
Accidents at work are never “just numbers.” They are sprained backs, burned hands, missed shifts, delayed projects, worried families, and sometimes a safety manager staring at a spreadsheet like it personally betrayed them. Still, numbers matter. When used correctly, an accident incident rate helps a business understand how often work-related injuries and illnesses are happening, compare performance across time periods, and spot safety problems before they become expensive, painful, or headline-worthy.
The good news: calculating an accident incident rate is not advanced wizard math. You do not need a crystal ball, a PhD, or a calculator that looks like it belongs at NASA. You need three things: the number of recordable incidents, the total hours worked, and the standard multiplier of 200,000. That multiplier represents 100 full-time employees working 40 hours per week for 50 weeks in a year. In other words, it turns your raw injury count into a rate that can be compared more fairly across companies, departments, or years.
This guide explains how to calculate accident incident rate in 10 practical steps, including examples, common mistakes, and real-world tips for using the result without accidentally turning safety into a scoreboard. Because when it comes to workplace safety metrics, the goal is not to “win” the spreadsheet. The goal is to send people home healthy.
What Is an Accident Incident Rate?
An accident incident rate is a standardized measurement used to estimate how frequently workplace injuries or illnesses occur during a specific period. In the United States, safety professionals often use OSHA-related calculations such as the Total Recordable Incident Rate, commonly called TRIR, and the DART rate, which tracks cases involving days away from work, restricted work, or job transfer.
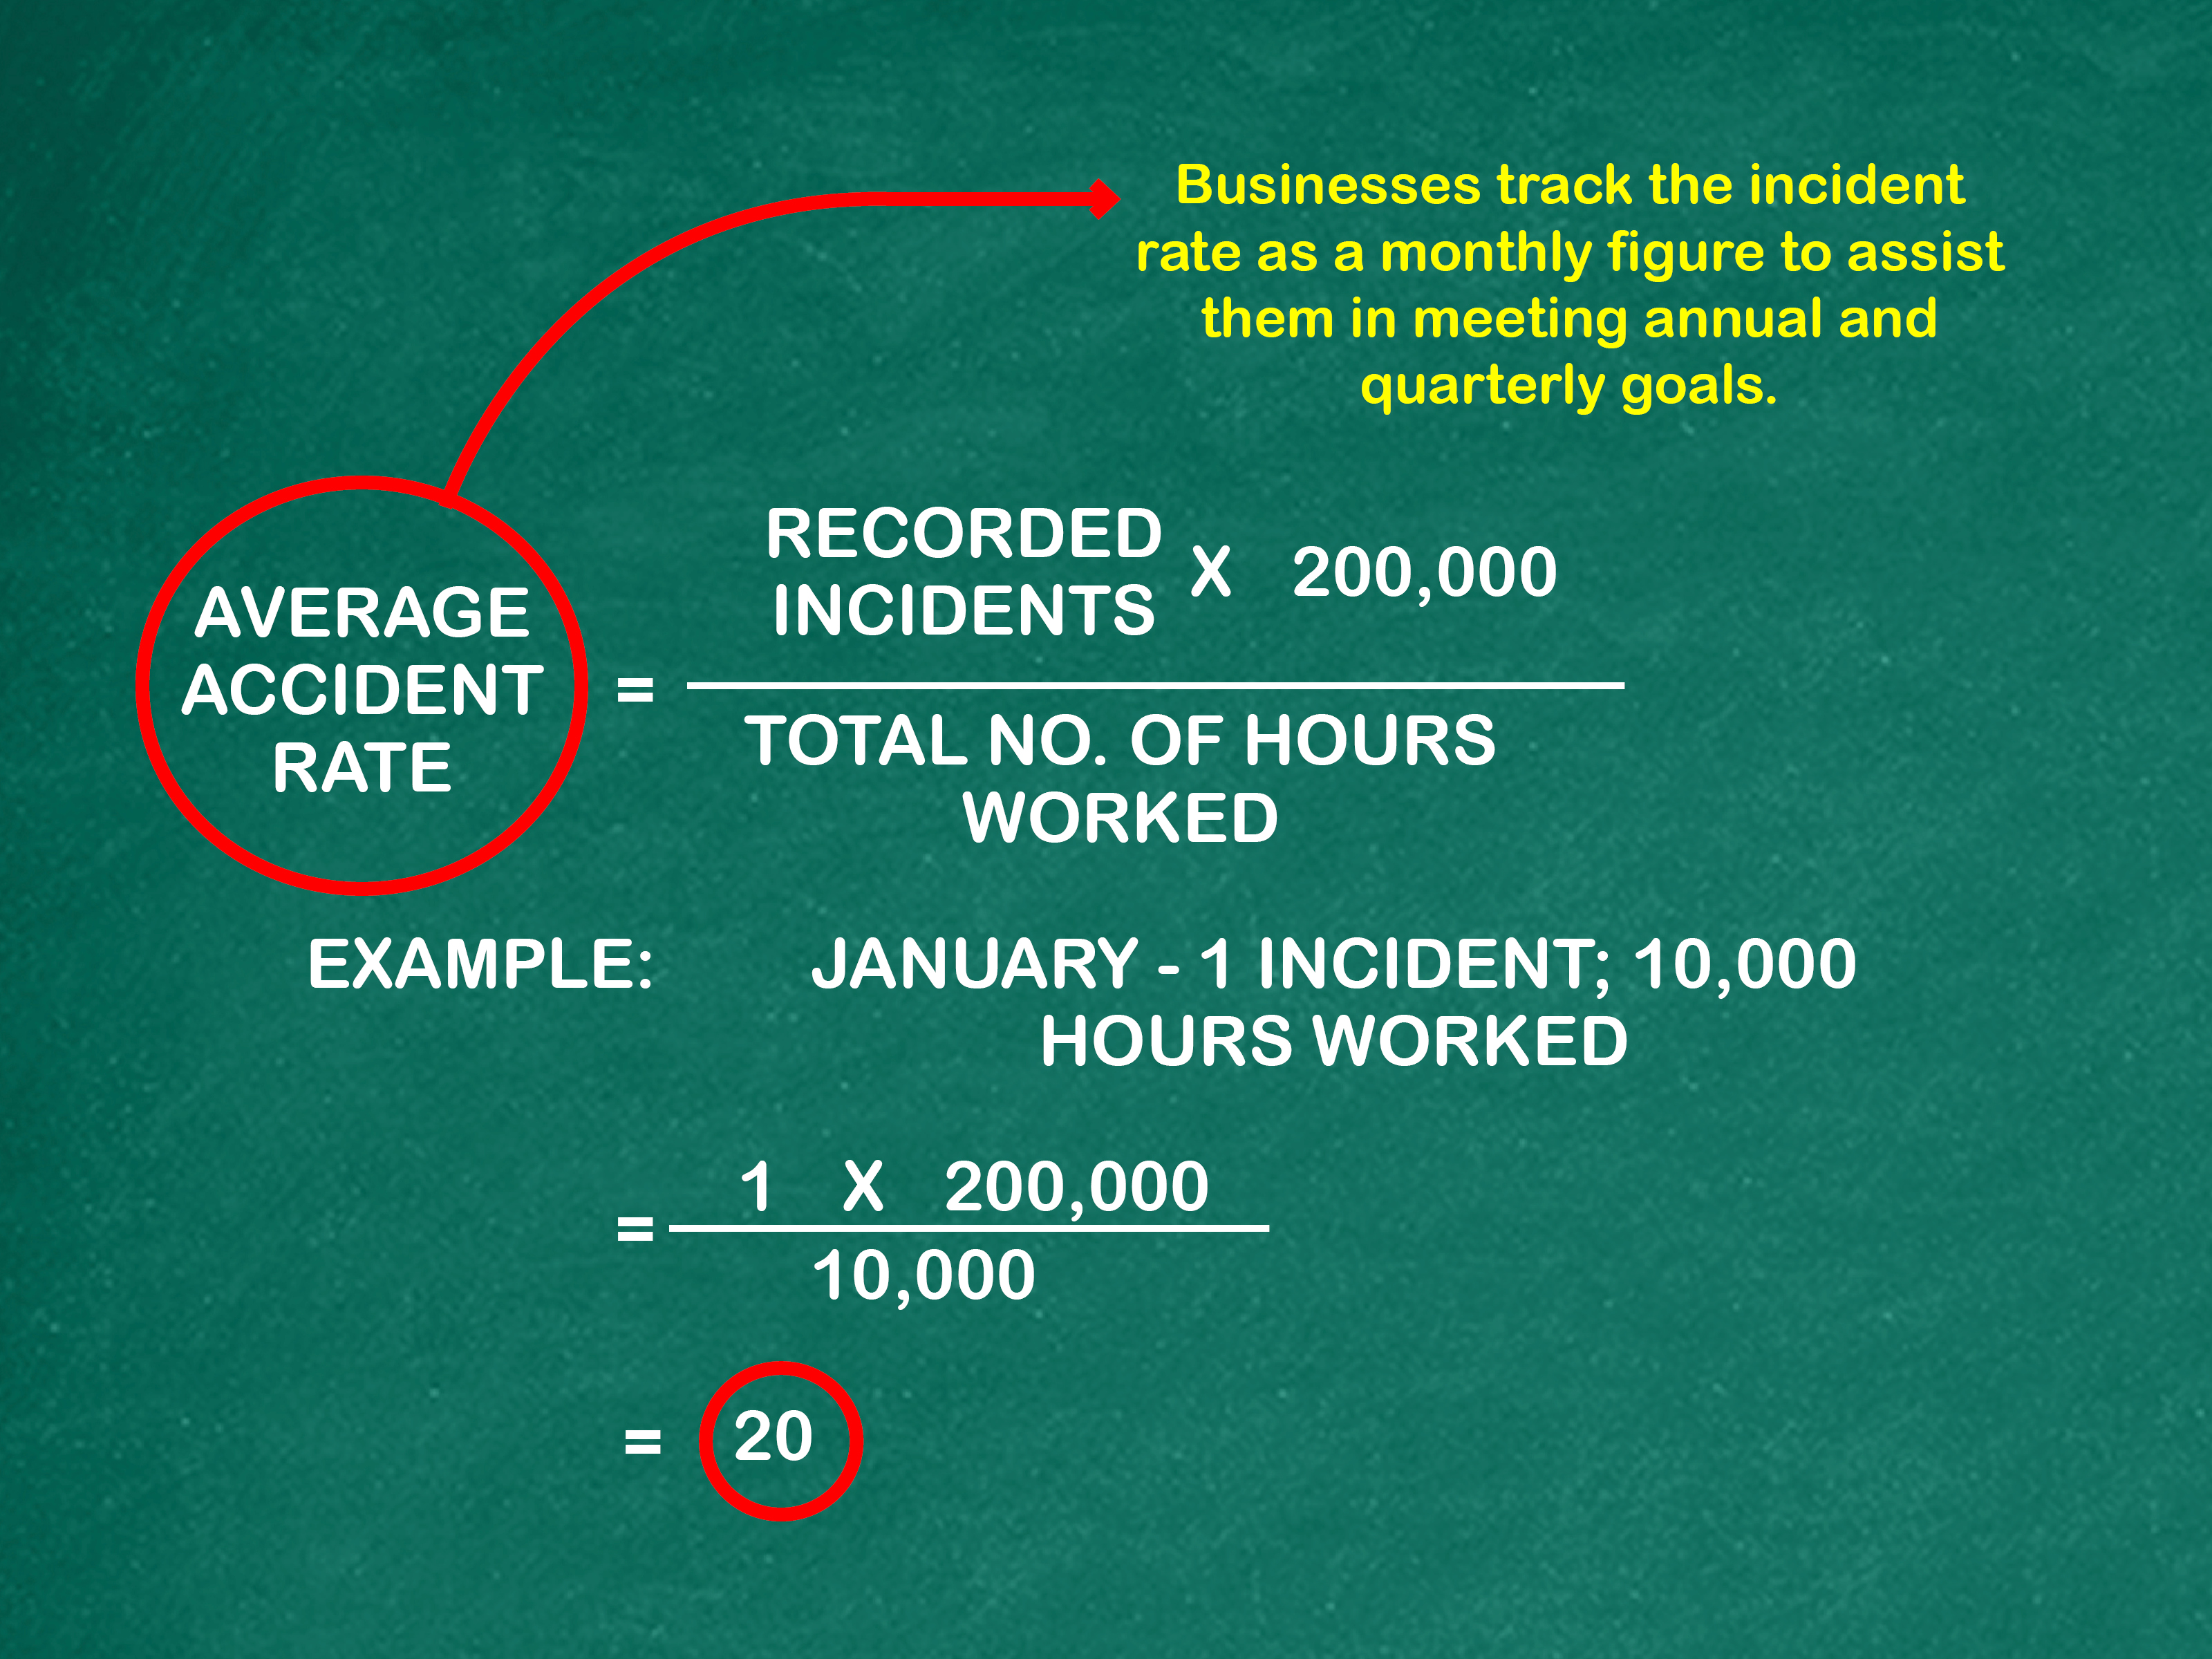
The basic accident incident rate formula is:
Incident Rate = (Number of Recordable Incidents × 200,000) ÷ Total Hours Worked
For example, if your company had 5 recordable incidents in one year and employees worked 250,000 total hours, the calculation would be:
(5 × 200,000) ÷ 250,000 = 4.0
That means your accident incident rate is 4.0 recordable incidents per 100 full-time workers. It does not mean four people were hurt out of every 100 employees exactly. It means your company’s incident frequency is equivalent to that rate when adjusted to the standard 200,000-hour base.
Why Accident Incident Rate Matters
Calculating workplace incident rate helps companies move beyond gut feelings. A supervisor may say, “This year feels safer,” but feelings are not exactly known for their spreadsheet discipline. Incident rates provide a consistent way to measure safety performance, compare departments, identify trends, and benchmark against industry averages.
However, accident incident rate should never be treated as the whole safety story. A low rate can be a positive sign, but it can also hide underreporting, weak hazard identification, or plain luck. A high rate may indicate serious risk, but it may also show that employees are actually reporting incidents honestly. The best safety programs use incident rates alongside inspections, near-miss reports, employee feedback, training records, job hazard analyses, and corrective-action follow-up.
How to Calculate Accident Incident Rate: 10 Steps
Step 1: Choose the Time Period
Start by deciding what period you want to measure. Most companies calculate incident rates annually because OSHA logs and year-end summaries are organized around the calendar year. However, you can also calculate monthly, quarterly, or project-specific incident rates if you want a closer look.
For example, a construction company may calculate the incident rate for one large jobsite over six months. A manufacturer may calculate monthly rates by department. A warehouse may compare first quarter performance with second quarter performance after launching new forklift training. The key is consistency. If one department reports annually and another reports quarterly, comparing them directly is like comparing a hard hat to a ham sandwich: technically possible, but not very useful.
Step 2: Define What Counts as a Recordable Incident
Before you count incidents, make sure you know what belongs in the count. Under OSHA recordkeeping criteria, a work-related injury or illness is generally recordable if it results in death, days away from work, restricted work, transfer to another job, medical treatment beyond first aid, loss of consciousness, or a significant injury or illness diagnosed by a licensed health care professional.
This distinction matters. A tiny paper cut treated with a basic adhesive bandage may be first aid and not recordable. A laceration requiring stitches is typically medical treatment beyond first aid and may be recordable. A sore wrist that results in restricted duty may also be recordable. When in doubt, review OSHA recordkeeping rules carefully or consult a qualified safety professional. Guessing is not a compliance strategy; it is just gambling with paperwork.
Step 3: Gather Your OSHA 300 Log or Incident Records
Next, collect the source records for the period you are measuring. For many employers, this means reviewing the OSHA Form 300 Log of Work-Related Injuries and Illnesses, Form 300A annual summary, and Form 301 incident reports or equivalent records.
Your records should include the date of the incident, employee job title, description of the injury or illness, classification of the case, and whether the case involved days away, restricted work, job transfer, or medical treatment beyond first aid. Clean records make clean calculations. Messy records make safety meetings feel like detective work, except nobody brought snacks.
Step 4: Count the Total Recordable Incidents
Now count the number of recordable incidents during your chosen period. This number becomes the numerator in the incident rate formula. For a Total Recordable Incident Rate, include all OSHA-recordable cases. For a DART rate, count only cases involving days away from work, restricted work activity, or job transfer.
Suppose a company had the following cases during the year:
- 2 injuries requiring medical treatment beyond first aid
- 1 injury resulting in days away from work
- 1 injury resulting in restricted duty
- 3 first-aid-only cases
The TRIR count would be 4 recordable cases. The 3 first-aid-only cases would not be included in the OSHA recordable total. The DART count would be 2 cases: the days-away case and the restricted-duty case.
Step 5: Calculate Total Hours Worked
Total hours worked is the denominator in the formula. Include the actual hours worked by all employees during the period. This may include full-time, part-time, temporary, seasonal, and hourly workers if they are part of the establishment’s covered workforce. Do not simply multiply headcount by 2,000 unless you are estimating and have no better data. Actual payroll hours are usually more accurate.
Generally, hours worked should not include vacation, holidays, sick leave, or other paid time off when employees were not actually working. If your payroll system can export total hours worked, use it. If your payroll system cannot, you may need to compile hours from timekeeping records, project logs, or department reports. Yes, this is the part where payroll becomes everyone’s favorite department for approximately seven minutes.
Step 6: Use the Standard Incident Rate Formula
Once you have the number of recordable incidents and the total hours worked, apply the formula:
Incident Rate = (Recordable Incidents × 200,000) ÷ Total Hours Worked
The 200,000 figure is used because it represents the annual work hours of 100 full-time employees working 40 hours per week for 50 weeks. This standardized base makes it easier to compare organizations of different sizes. Without it, a company with 1,000 employees would almost always have more incidents than a company with 20 employees, even if the smaller company was actually riskier on a per-worker basis.
Step 7: Work Through a Simple Example
Let’s say Bright Bolt Manufacturing had 6 OSHA-recordable incidents last year. Its employees worked 300,000 total hours. Here is the calculation:
(6 × 200,000) ÷ 300,000 = 4.0
Bright Bolt’s Total Recordable Incident Rate is 4.0. This means the company had the equivalent of 4 recordable incidents per 100 full-time workers during the year.
Now let’s say only 3 of those cases involved days away, restricted work, or job transfer. The DART calculation would be:
(3 × 200,000) ÷ 300,000 = 2.0
Bright Bolt’s DART rate is 2.0. The TRIR gives a broader picture of recordable injuries and illnesses, while the DART rate focuses on more serious cases that affected an employee’s ability to work normally.
Step 8: Round the Result Consistently
Most companies round incident rates to one or two decimal places. For example, 3.666 becomes 3.7 if rounding to one decimal place, or 3.67 if rounding to two. Choose a rounding method and use it consistently across reports.
Do not manipulate rounding to make the number look better. A rate of 2.96 rounded down in one report and 3.04 rounded up in another may not seem like a big deal, but inconsistent reporting can damage trust. Safety data should be boringly honest. Boring honesty is underrated, especially when regulators, insurers, executives, and employees may all care about the numbers.
Step 9: Compare the Rate Carefully
After calculating your accident incident rate, compare it with your own past performance and, where appropriate, with industry benchmarks. Comparing this year’s rate with last year’s can reveal whether your safety program is improving, declining, or doing the statistical cha-cha. Industry comparisons can also help you understand whether your rate is unusually high or low for your type of work.
Be careful, though. A software office and a roofing contractor do not face the same hazards. A small company can also see large rate swings from just one incident because the denominator is smaller. If a 10-person business has one recordable injury, its rate may look dramatic even though the raw count is low. Always interpret the number in context.
Step 10: Turn the Number Into Action
The final step is the most important: use the accident incident rate to improve safety. A rate by itself does not prevent injuries. It is a smoke alarm, not a firefighter. If the rate increases, investigate why. Are incidents clustered in one department? Are new employees getting hurt more often? Are hand injuries rising? Are slips and falls happening after cleaning shifts? Are supervisors closing corrective actions on time?
Use your findings to improve training, update procedures, fix hazards, review personal protective equipment, coach supervisors, and involve employees in prevention. The best safety teams do not just calculate the rate and drop it into a PowerPoint slide where hope goes to nap. They ask what the rate is trying to tell them.
Common Types of Workplace Incident Rates
Total Recordable Incident Rate
Total Recordable Incident Rate, or TRIR, measures all OSHA-recordable injuries and illnesses. It is one of the most commonly used workplace safety metrics. Companies often track TRIR annually and compare it with previous years or industry averages.
DART Rate
DART stands for Days Away, Restricted, or Transferred. The DART rate focuses on recordable cases that had a stronger effect on the employee’s ability to work. The formula is similar:
DART Rate = (DART Cases × 200,000) ÷ Total Hours Worked
A company may have a moderate TRIR but a low DART rate, suggesting that many incidents were recordable but did not result in days away, restricted duty, or transfer. Conversely, a high DART rate may indicate more severe injuries or ineffective return-to-work controls.
Lost Time Incident Rate
Lost Time Incident Rate, often called LTIR, focuses on injuries that resulted in lost workdays. Some companies use this metric internally to measure the frequency of more serious incidents. The formula usually follows the same structure:
LTIR = (Lost Time Cases × 200,000) ÷ Total Hours Worked
Because terminology can vary by organization, define “lost time” clearly before reporting LTIR. Otherwise, two departments may use the same acronym while counting different things, which is how meetings become longer than necessary.
Example: Accident Incident Rate for a Small Business
Imagine a small electrical contractor with 28 employees. Over the past year, employees worked 52,000 total hours. The company had 2 OSHA-recordable injuries: one burn requiring medical treatment beyond first aid and one fall that led to restricted duty.
The TRIR calculation is:
(2 × 200,000) ÷ 52,000 = 7.69
Rounded to one decimal place, the TRIR is 7.7.
The DART calculation includes the restricted-duty fall but not the burn if the burn did not involve days away, restricted work, or transfer:
(1 × 200,000) ÷ 52,000 = 3.85
Rounded to one decimal place, the DART rate is 3.8.
At first glance, 7.7 may look alarming. But because the company is small, each recordable incident has a large effect on the rate. That does not mean the company should ignore it. It means leaders should investigate the incidents, improve controls, and watch trends over time instead of panicking over one annual number.
Frequent Mistakes When Calculating Accident Incident Rate
Mistake 1: Counting All Incidents Instead of Recordable Incidents
Not every workplace incident belongs in the OSHA recordable count. Near misses, property damage, and first-aid-only cases may be valuable for internal safety analysis, but they are not automatically included in TRIR. Keep separate categories so your OSHA incident rate stays accurate and your internal prevention data remains useful.
Mistake 2: Using Headcount Instead of Hours Worked
The formula requires total hours worked, not the number of employees. Headcount can be misleading because it does not account for overtime, part-time schedules, seasonal staffing, or turnover. A company with 50 employees working heavy overtime may have more exposure hours than a company with 60 employees working standard schedules.
Mistake 3: Forgetting Temporary or Seasonal Workers
If temporary, seasonal, or contract workers are supervised day-to-day by your company, their hours and injuries may need to be considered in your recordkeeping process. This area can be tricky, so review applicable guidance and make sure responsibility is clearly assigned before an incident occurs.
Mistake 4: Comparing Unrelated Industries
Benchmarking is useful only when the comparison makes sense. A call center should not compare its incident rate with a steel mill and then throw a celebration because nobody got hit by molten metal. Compare your rate with similar operations, similar workforce sizes, and similar risk profiles whenever possible.
Mistake 5: Treating a Low Rate as Proof of Safety
A low accident incident rate is encouraging, but it is not proof that hazards are controlled. Some workplaces have low rates because employees are afraid to report injuries. Others get lucky for a while. Strong safety programs look at leading indicators too, such as safety observations, hazard corrections, training completion, equipment inspections, and near-miss reporting.
How to Use Incident Rate to Improve Safety Performance
Once you calculate your accident incident rate, do not let it gather digital dust. Break the number down by department, job task, location, shift, injury type, and employee experience level. Patterns often hide inside the total. A companywide TRIR may look stable, while one warehouse aisle, production line, or maintenance activity quietly causes repeat injuries.
Next, connect the data to corrective actions. If slips and falls are rising, review housekeeping, floor conditions, footwear, drainage, lighting, and spill response. If hand injuries dominate the log, examine machine guarding, cut-resistant gloves, tool selection, lockout practices, and rushing during changeovers. If new hires are getting hurt, strengthen onboarding and mentoring.
Finally, communicate the results in a way employees understand. Instead of saying, “Our TRIR increased from 2.8 to 3.4,” explain what changed, what the company learned, and what actions are being taken. Numbers can guide the conversation, but people create the safer workplace.
Practical Experiences and Lessons From Calculating Accident Incident Rate
In real workplaces, calculating accident incident rate is usually less about the formula and more about the discipline behind the data. The formula is easy. The hard part is building a reporting culture where employees tell the truth, supervisors document consistently, and leaders resist the temptation to treat every recordable case like a personal insult from the universe.
One common experience is discovering that departments define incidents differently. Maintenance may report every strain, cut, and near miss. Production may report only injuries that require clinic visits. The office team may not report anything unless a chair actually files a complaint. When that happens, the incident rate may say more about reporting habits than safety performance. A good first step is to train supervisors on what counts as first aid, what counts as medical treatment beyond first aid, and when restricted work or days away must be recorded.
Another practical lesson is that payroll hours can be surprisingly messy. Safety teams sometimes receive rounded estimates, missing temporary-worker hours, or reports that include paid time off. These errors can distort the denominator and make the rate look higher or lower than it should. The best approach is to create a repeatable process with payroll or HR. Decide exactly where hours worked will come from, who will pull the report, when it will be pulled, and how temporary or seasonal labor will be handled.
Small businesses often experience the “one incident problem.” When total hours worked are low, one recordable injury can produce a large incident rate. This can feel unfair, especially if the business has strong safety practices and the injury was unusual. Still, the number should not be ignored. Instead of getting defensive, use the incident as a learning opportunity. Was the hazard known? Was training clear? Was equipment maintained? Was the worker rushed? Was supervision adequate? A single incident can reveal a system weakness before it repeats.
Large companies face a different challenge: averages can hide hotspots. A national company may have a decent overall TRIR while one location struggles with repeated injuries. That is why it helps to calculate incident rates by site, division, task, and shift. When you break the data into smaller pieces, the story becomes clearer. Maybe the night shift has more strains because staffing is thin. Maybe one facility has more slips because floor drains are poorly designed. Maybe hand injuries increase every time production volume spikes. The rate is the doorway; the investigation is the room.
Many safety professionals also learn that incident rates can accidentally encourage underreporting if leadership overreacts. If bonuses, public rankings, or management praise are tied only to low rates, employees may hide injuries to “protect the number.” That is a dangerous bargain. A clean spreadsheet is not worth an untreated injury. Better safety leadership rewards reporting, hazard correction, and prevention activitiesnot silence.
The most useful experience is learning to pair lagging indicators with leading indicators. Incident rate tells you what already happened. Leading indicators tell you whether the system is getting stronger before someone gets hurt. Examples include completed safety observations, corrected hazards, preventive maintenance tasks, training quality, ergonomic improvements, and employee safety suggestions. When incident rates and leading indicators are reviewed together, safety becomes proactive instead of reactive.
Finally, the best teams make the calculation routine but the conversation meaningful. They do not spend an hour arguing over decimals while ignoring the injured worker’s experience. They calculate the rate, verify the data, study the pattern, and then ask the most important question: “What will we change?” That question is where safety improves. The math simply points the flashlight.
Conclusion
Learning how to calculate accident incident rate is a valuable skill for any employer, safety manager, HR professional, or operations leader. The core formula is simple: multiply the number of recordable incidents by 200,000, then divide by total hours worked. But the real value comes from using the result wisely.
A workplace incident rate can help you identify trends, compare performance, and focus prevention efforts. It can show whether safety initiatives are working and whether certain departments or tasks need attention. But it should never become a vanity metric. The goal is not to make the number look pretty. The goal is to reduce injuries, strengthen reporting, fix hazards, and protect people.
Use incident rates as one tool in a broader safety system. Combine them with near-miss reports, inspections, training feedback, employee conversations, and corrective-action tracking. When the math and the human side work together, your safety program becomes more than a compliance exercise. It becomes a practical way to keep workers healthy, confident, and able to go home in the same condition they arrivedminus, perhaps, a little workplace coffee fatigue.