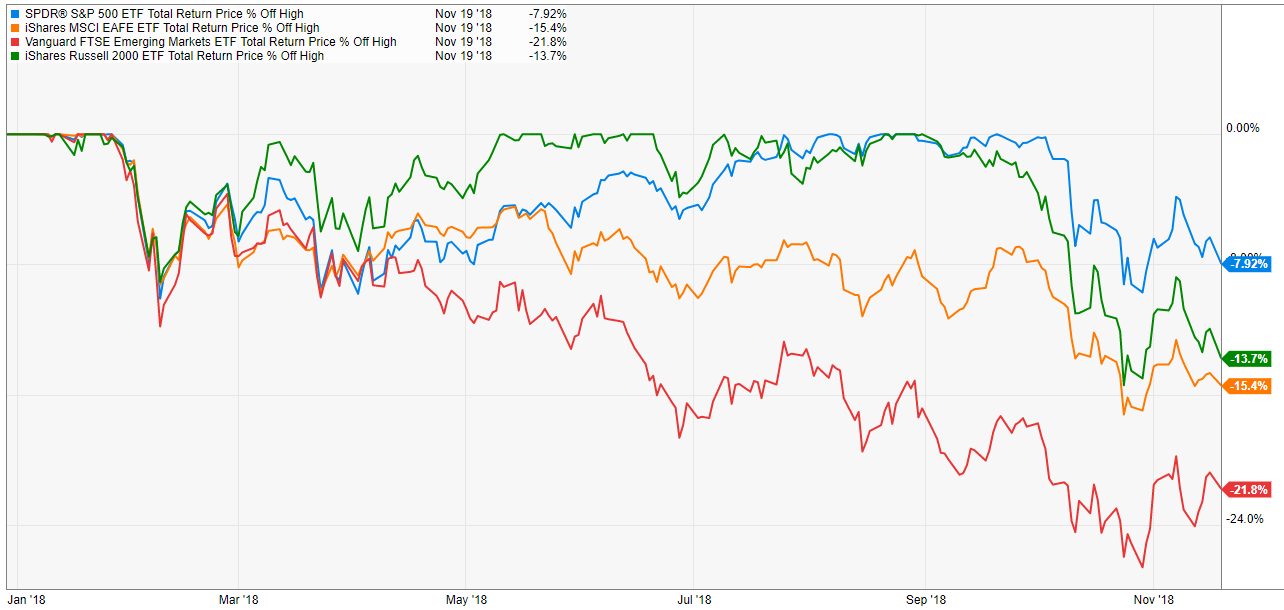

Every stock market selloff has a dramatic soundtrack. Financial television gets louder, red arrows multiply like rabbits, and someone on social media announces that “this is the big one” before breakfast. But surveying the damage in stocks requires less theater and more flashlight. You are not just looking at whether the S&P 500 fell on Wednesday or bounced on Thursday. You are asking where the cracks are, which parts of the market are still standing, and whether the damage is a temporary bruise or a structural fracture.
In mid-2026, the U.S. stock market has been both impressive and jumpy. Major indexes have hovered near record territory, powered by artificial intelligence enthusiasm, strong corporate earnings, and surprisingly resilient consumer spending. At the same time, investors have had to process sticky inflation, higher energy prices, a Federal Reserve that is not rushing to cut rates, geopolitical headlines, and signs of intense concentration in a handful of mega-cap technology and semiconductor stocks. In other words, the market is wearing a tuxedo on top and muddy boots underneath.
This article takes a practical look at stock market damage: how to measure it, what recent market action says, which sectors tend to crack first, and how long-term investors can respond without turning their portfolios into an emotional piñata.
What Does “Damage” in Stocks Actually Mean?
When investors say the stock market is damaged, they usually mean prices are down. That is only the first layer. A market can fall sharply and remain healthy if the decline is broad, quick, and tied to a temporary shock. A market can also look calm at the index level while serious trouble is hiding underneath. That second version is sneakier, like a leaky roof discovered only after the living room becomes a pond.
Real stock market damage shows up in several ways: declining market breadth, falling earnings expectations, valuation compression, liquidity stress, sector rotation, and investor capitulation. The headline index tells you what happened to the big names. Breadth tells you how many stocks are participating. Earnings revisions tell you whether companies are still expected to grow. Valuations tell you how much investors are willing to pay for that growth. Credit spreads, rates, and volatility reveal whether the financial plumbing is still working.
A useful market checkup starts with three questions: Are most stocks falling, or only a few? Are earnings estimates holding up, or being cut? Are investors selling because prices are high, or because fundamentals are deteriorating? The answers matter because a market pullback caused by valuation anxiety is different from one driven by recession risk.
The 2026 Market Backdrop: Strong Indexes, Nervous Internals
Recent U.S. stock action has been a tug-of-war between optimism and caution. On one side, the S&P 500, Nasdaq, and Russell 2000 have posted solid year-to-date gains, with small caps and technology shares showing powerful rebounds after periods of volatility. Semiconductor and AI-linked names have remained central to market leadership, while corporate earnings forecasts have generally supported the bull case.
On the other side, inflation has refused to quietly leave the party. May consumer prices rose faster than investors would like, with energy costs playing a major role. The Federal Reserve kept its benchmark rate steady in June, but the market reaction showed that investors are sensitive to any hint that rates could stay higher for longer or even rise again. Stocks love lower rates the way houseplants love sunlight; remove that sunlight, and the leaves can droop quickly.
The result is a market that does not look broken, but does look selective. Indexes can keep climbing when the largest companies are doing the heavy lifting. However, if leadership becomes too narrow, the market becomes vulnerable. It is like a dinner table balanced on one very muscular leg: impressive, but not exactly relaxing.
Market Breadth: The First Place to Look for Hidden Bruises
Market breadth measures how many stocks are moving up versus down. When the S&P 500 rises because hundreds of companies are gaining, the rally has broad support. When the index rises because a few giants are sprinting while the rest of the market is wheezing, investors should pay attention.
Recent trading has shown mixed breadth signals. Some sessions have delivered strong new highs and broad participation, while others revealed weakness beneath the surface, especially in Nasdaq-listed stocks. This matters because market damage often begins quietly. The index may look fine, but more individual stocks start making new lows, sector leadership narrows, and laggards fail to recover during rallies.
For everyday investors, breadth can be translated into a simple habit: do not judge the market only by the S&P 500 headline. Look at small caps, equal-weight indexes, sector performance, and the number of stocks trading above their moving averages. If the generals are advancing but the troops are retreating, the battle is not as clean as the headline suggests.
AI Stocks: Engine of the Rally or Overcrowded Trade?
Artificial intelligence has been the market’s favorite growth story, and for good reason. Data centers, chips, memory, cloud infrastructure, and enterprise software have attracted enormous investment. Companies tied to this ecosystem have delivered eye-popping returns, and earnings expectations for many technology firms remain strong.
But every great market theme eventually faces the same awkward question: how much future perfection is already priced in? AI can be transformative and still produce painful stock corrections if expectations become too heroic. Investors learned this during the dot-com era, when the internet changed the world, but many internet stocks still changed shareholders’ net worth in the wrong direction.
The current AI trade is not automatically a bubble. Many leading companies have real revenue, profit margins, and competitive advantages. Still, concentration risk is real. If too much of the index depends on one theme, any disappointment in capital spending, margins, or growth guidance can ripple through the broader market. When everyone crowds into the same elevator, nobody enjoys hearing a weird mechanical noise.
Inflation and Interest Rates: The Market’s Weather System
Inflation does not just affect grocery bills and gasoline receipts. It changes the math of stock valuation. When inflation is sticky, the Federal Reserve has less room to cut rates. Higher interest rates can make future corporate earnings less valuable today, especially for growth stocks whose profits are expected far into the future.
That is why inflation surprises often hit technology and high-valuation stocks harder than defensive sectors. A company trading at a rich multiple needs investors to believe in long-term growth and supportive financial conditions. If rates rise, that belief gets tested. The market starts asking: “How much am I paying for this dream, and does the dream come with free shipping?”
Energy-driven inflation adds another twist. Higher oil and gasoline prices can lift revenue for energy producers but squeeze consumers, transportation companies, retailers, and businesses with high input costs. If energy prices cool, stocks may breathe easier. If energy pressure persists, investors may become more cautious about profit margins and household spending.
Earnings: The Foundation Under the Floorboards
Stock prices can run ahead of earnings for a while, but over time, corporate profits are the foundation. If earnings estimates keep rising, market pullbacks can become buying opportunities. If earnings estimates begin falling broadly, a correction can deepen.
Recent earnings data has been supportive overall. Many S&P 500 companies have beaten analyst expectations, and forward earnings estimates have remained healthy. Technology, financials, energy, and select industrial companies have shown resilience. That helps explain why investors have not abandoned stocks despite inflation and rate worries.
Still, earnings strength is not evenly distributed. Some companies are thriving because they have pricing power, strong balance sheets, and exposure to durable demand. Others are struggling with higher borrowing costs, weaker consumer traffic, or margin pressure. Surveying the damage means separating companies with temporary stock price wounds from companies with deteriorating business models.
Sector Damage: Where the Cracks Usually Appear
Technology and Semiconductors
Technology remains the glamour sector, but glamour comes with a cover charge. Semiconductor stocks can move violently because they sit at the intersection of AI demand, capital spending cycles, geopolitics, and valuation sensitivity. When chip stocks fall, the broader market often feels it quickly because these companies carry heavy index weight.
Small Caps
Small-cap stocks are often more sensitive to interest rates because smaller companies rely more heavily on external financing. When rates are high, debt refinancing becomes more expensive. However, small caps can also rebound sharply when investors expect economic acceleration or easier financial conditions. Their strong recent gains suggest investors have not given up on domestic growth, but volatility remains part of the package.
Financials
Banks can benefit from higher rates, but only up to a point. If rates stay elevated while credit quality weakens, regional banks and lenders can face pressure. Investors should watch deposit costs, loan growth, commercial real estate exposure, and credit losses.
Consumer Stocks
Consumer discretionary stocks reveal how households are feeling. Wealthier consumers may keep spending, but lower- and middle-income households can feel inflation more sharply. Retailers, restaurants, travel companies, and auto-related businesses often provide clues about whether consumers are bending or breaking.
Energy
Energy can act as both shelter and storm cloud. Rising oil prices may help energy producers, but they can hurt the broader economy. Investors should be careful not to treat energy gains as universally bullish. Sometimes the energy sector is smiling because everyone else just got a larger bill.
Valuation Damage: When Prices Fall but Stocks Are Still Not Cheap
A market decline does not automatically create bargains. If a stock falls 15% after rising 80%, it may still be expensive. Valuation damage occurs when investors stop paying premium multiples for uncertain growth. This can happen even when earnings are fine.
The S&P 500 has continued to trade above long-term average valuation levels by several common measures. That does not mean a crash is inevitable. Valuation is a poor short-term timing tool. Expensive markets can become more expensive, especially when earnings are rising and liquidity is supportive. But elevated valuations reduce the margin for error. A small disappointment can trigger a large price move.
For investors, the key is not to obsess over whether the market is “cheap” or “expensive” in one number. Instead, compare price to quality. A high-quality company with durable earnings, low debt, and strong cash flow may deserve a premium. A weak company wearing a premium valuation like a rented tuxedo deserves more skepticism.
How Long-Term Investors Can Survey Their Own Portfolio Damage
When stocks wobble, investors often ask the wrong question first: “Should I sell?” A better first question is: “What exactly has changed?” Your portfolio may be down because the whole market is down, because you are overly concentrated, because one sector is under pressure, or because your original thesis was wrong. Those are very different situations.
Start with asset allocation. If your plan called for 70% stocks and 30% bonds, but a strong rally pushed you to 85% stocks, you may have more risk than you intended. Rebalancing is not exciting, which is precisely why it works. It forces you to trim what has grown too large and add to what has lagged, instead of making decisions based on vibes, panic, or one particularly dramatic headline.
Next, check concentration. If one stock, sector, or theme dominates your portfolio, your results may depend too heavily on one outcome. Concentration can build wealth, but it can also remove it with shocking efficiency. Diversification is not designed to make you look brilliant at cocktail parties. It is designed to keep one bad idea from eating the entire buffet.
Finally, compare your holdings to your time horizon. A 30-year-old saving for retirement can usually tolerate more volatility than someone planning to spend portfolio income next year. The same market decline can be an opportunity for one investor and a serious risk-management problem for another.
Common Mistakes Investors Make After Market Damage
The first mistake is panic selling after the damage is already visible. Selling after a sharp decline can lock in losses and create a new problem: deciding when to get back in. Many investors who sell during volatility wait for “clarity,” but markets often recover before clarity arrives. By the time the headlines sound safe, prices may already be higher.
The second mistake is buying every dip without discipline. Not every falling stock is a bargain. Some are falling because the business is weakening. Others are falling because expectations were absurd. A disciplined dip-buying plan should focus on quality, valuation, and position size.
The third mistake is confusing excitement with strategy. Hot themes can be profitable, but they should not replace portfolio construction. If your investment plan can be summarized as “AI, vibes, and maybe a semiconductor ETF,” it might be time for a grown-up conversation with your spreadsheet.
A Practical Damage Checklist for Stock Investors
Use this quick checklist when markets get rough:
- Index level: Is the market down 5%, 10%, or 20% from recent highs?
- Breadth: Are most stocks falling, or only a narrow group?
- Leadership: Are defensive sectors leading, or are growth and cyclicals still participating?
- Earnings: Are analysts raising or cutting estimates?
- Rates: Are bond yields rising in a way that pressures valuations?
- Credit: Are credit spreads widening, suggesting financial stress?
- Portfolio risk: Has one position or theme become too large?
- Time horizon: Do you need the money soon, or can you ride out volatility?
This checklist will not predict tomorrow’s market move. Nothing legal, ethical, and publicly available will do that reliably. But it can keep you from reacting blindly, which is half the battle.
Conclusion: The Market Is Bruised, Not Necessarily Broken
Surveying the damage in stocks is not about declaring that the market is doomed every time the Nasdaq has a bad hair day. It is about looking beneath the surface. In 2026, the U.S. stock market has shown real strength: resilient earnings, powerful technology leadership, and investor willingness to buy dips. But the risks are also real: sticky inflation, uncertain Fed policy, high valuations, AI concentration, and uneven sector participation.
The smartest response is not panic or blind optimism. It is inspection. Review your allocation. Check your concentration. Know what you own and why you own it. Rebalance when needed. Keep enough cash or short-term reserves for near-term obligations. For long-term investors, volatility is not an interruption of the process; it is part of the process.
Stocks will always have damage surveys. The trick is learning whether you are looking at a cracked window, a leaky roof, or a house that is still perfectly livable but badly in need of someone turning off financial television.
Experience Notes: What Surveying Stock Damage Feels Like in Real Life
Anyone who has lived through a market selloff knows that the hardest part is not reading the numbers. The hard part is managing the little committee of emotional raccoons that suddenly holds an emergency meeting inside your head. One raccoon wants to sell everything. Another wants to buy risky stocks because they are “on sale.” A third is eating cereal directly from the box and refreshing the brokerage app every 11 seconds.
The most useful experience I have learned from studying market downturns is that the first reaction is usually too dramatic. A red day feels permanent while it is happening. A 3% drop can feel like the financial equivalent of a piano falling from the sky. But when you step back and compare the decline to the market’s long-term history, it often looks less catastrophic. This does not mean investors should ignore risk. It means they should measure risk before obeying fear.
A practical habit is to write down your investment thesis before trouble arrives. For example: “I own this broad-market index fund for retirement 20 years from now.” Or: “I own this dividend stock because its cash flow supports the payout and the balance sheet is strong.” When markets fall, you can revisit the thesis. If the reason still holds, price damage alone may not require action. If the reason no longer holds, that is different. A broken thesis deserves attention. A noisy market deserves coffee.
Another experience is that diversification feels boring until it becomes beautiful. During roaring bull markets, diversified portfolios can feel disappointing because they rarely own enough of the hottest stock. But during selloffs, diversification can act like shock absorbers on a very bumpy road. Bonds, cash, defensive stocks, international exposure, and different sectors may not all rise, but they can reduce the chance that one bad corner of the market ruins the entire trip.
It also helps to separate investing money from survival money. Money needed for rent, taxes, tuition, medical bills, or near-term business expenses should not be sitting in volatile stocks hoping for mercy from the market gods. Keeping a cash reserve may lower potential returns in a bull market, but it can prevent forced selling during a downturn. Forced selling is one of the great villains of personal finance, right up there with high-interest debt and subscription services you forgot you had.
Finally, the best investors I have observed treat market damage like a maintenance inspection, not a personal insult. They do not ask, “Why is the market doing this to me?” The market does not know you exist. It is not plotting against your vacation fund. Instead, they ask: “What changed? What is overexposed? What is still working? What needs trimming? What deserves patience?” That shift turns volatility from a panic event into a decision-making event. It may not make selloffs fun, but it does make them useful.
Note: This article is for educational and informational purposes only. It is not personalized investment, tax, or financial advice. Readers should consider their own goals, risk tolerance, and time horizon before making investment decisions.