
Graphing sine and cosine functions may look intimidating at first, especially when the equation starts wearing accessories like amplitude, period, phase shift, and vertical shift. But once you know what each part of the equation does, the graph becomes much less mysterious. Think of a sine or cosine graph as a smooth wave with a regular rhythm. Your job is not to wrestle it into place; your job is to read its pattern and plot it with confidence.
In this guide, you will learn how to graph sine and cosine functions in 15 clear steps. We will cover the parent graphs, key points, amplitude, period, midline, phase shift, vertical shift, reflections, and practical examples. By the end, you should be able to look at an equation such as y = 2sin(3x – π) + 1 and say, “Ah yes, a wave with a plan,” instead of quietly closing your notebook and pretending algebra never happened.
Understanding Sine and Cosine Graphs
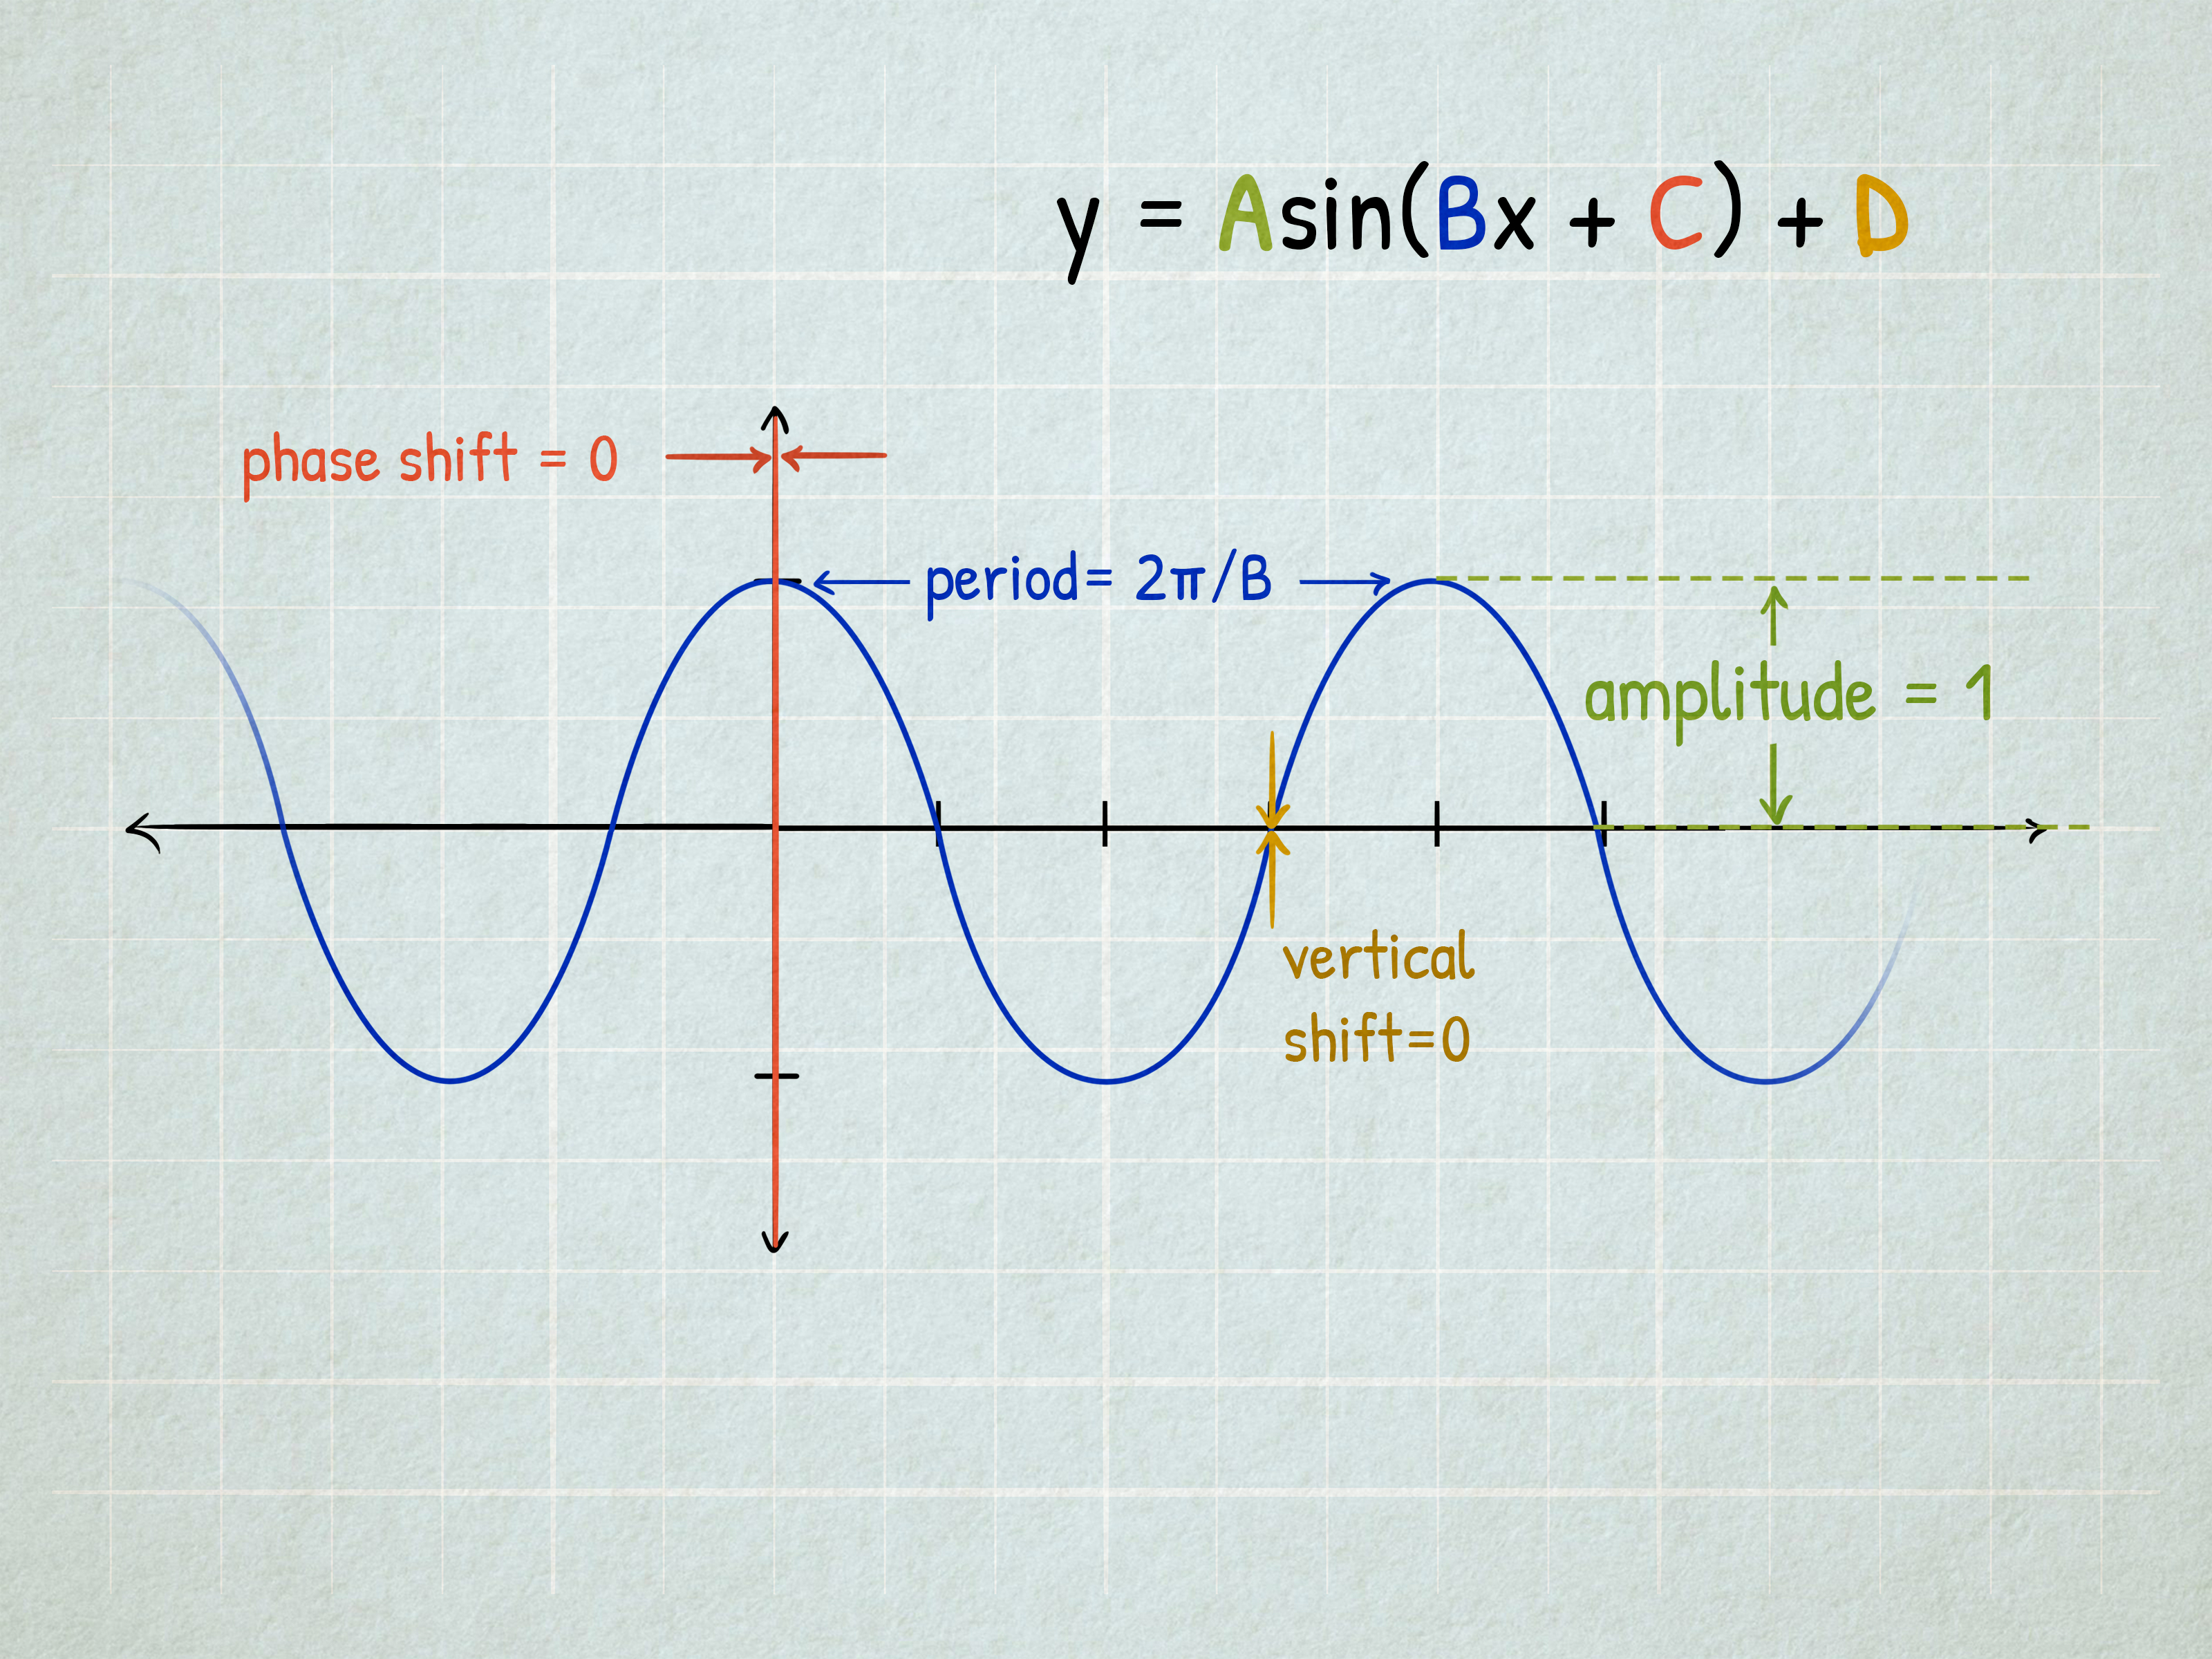
Sine and cosine functions are called periodic functions because they repeat their values in regular cycles. The basic sine function is y = sin x, and the basic cosine function is y = cos x. Both have a period of 2π, an amplitude of 1, and a midline of y = 0. Their graphs continue forever to the left and right, repeating the same smooth wave pattern.
The main difference between sine and cosine is where the wave starts. The sine graph starts at the midline, rises to a maximum, returns to the midline, falls to a minimum, and returns again. The cosine graph starts at a maximum, drops to the midline, reaches a minimum, returns to the midline, and ends back at a maximum. Same wave family, different opening move.
The Standard Form of Sine and Cosine Functions
Most transformed sine and cosine functions can be written in one of these forms:
y = A sin(Bx – C) + D
y = A cos(Bx – C) + D
Each letter controls a specific feature of the graph:
- A controls the amplitude and reflection.
- B controls the period.
- C helps determine the phase shift.
- D controls the vertical shift and midline.
Once you know how to identify these values, graphing becomes a step-by-step process instead of a guessing game with fancy curves.
How to Graph Sine and Cosine Functions in 15 Steps
Step 1: Identify Whether the Function Is Sine or Cosine
Start by checking the function name. Is it sin or cos? This matters because the parent graph begins differently. A sine graph starts on the midline. A cosine graph starts at a maximum when the coefficient is positive.
For example, y = sin x begins at (0, 0), while y = cos x begins at (0, 1). That small difference can completely change your first plotted point.
Step 2: Memorize the Five Key Points of the Parent Sine Graph
For one cycle of y = sin x, the five key points are:
- (0, 0)
- (π/2, 1)
- (π, 0)
- (3π/2, -1)
- (2π, 0)
These points show the sine graph starting at the midline, reaching its highest point, crossing the midline, reaching its lowest point, and returning to the midline. If you can remember these five points, you already have the skeleton of the graph.
Step 3: Memorize the Five Key Points of the Parent Cosine Graph
For one cycle of y = cos x, the five key points are:
- (0, 1)
- (π/2, 0)
- (π, -1)
- (3π/2, 0)
- (2π, 1)
The cosine graph starts at the top, moves downward, reaches the bottom, and returns to the top. It is like sine’s more dramatic cousin who enters the room already at peak energy.
Step 4: Find the Amplitude
The amplitude is the distance from the midline to the maximum or minimum value. In the standard form y = A sin(Bx – C) + D or y = A cos(Bx – C) + D, the amplitude is:
|A|
For example, in y = 3sin x, the amplitude is 3. That means the graph rises 3 units above the midline and falls 3 units below it. In y = -4cos x, the amplitude is 4. The negative sign does not make the amplitude negative; it reflects the graph.
Step 5: Determine the Midline
The midline is the horizontal line that runs through the center of the wave. In the equation, the midline is determined by D:
y = D
For example, in y = 2sin x + 5, the midline is y = 5. The entire graph shifts up 5 units. In y = cos x – 3, the midline is y = -3. This is where the wave balances.
Step 6: Calculate the Maximum and Minimum Values
Once you know the amplitude and midline, you can find the highest and lowest points of the graph.
Maximum = D + |A|
Minimum = D – |A|
For y = 4sin x – 2, the amplitude is 4 and the midline is y = -2. The maximum is -2 + 4 = 2, and the minimum is -2 – 4 = -6. So the graph moves between y = 2 and y = -6.
Step 7: Find the Period
The period is the length of one complete cycle. For sine and cosine functions, the basic period is 2π. When the equation includes a coefficient B inside the function, the period becomes:
Period = 2π / |B|
For example, in y = sin(2x), B = 2, so the period is 2π / 2 = π. The graph completes one full cycle in only π units, so it is horizontally compressed. In y = cos(x/2), B = 1/2, so the period is 2π / (1/2) = 4π. The graph stretches out like it is taking a leisurely Sunday walk.
Step 8: Divide the Period Into Four Equal Parts
Sine and cosine graphs are easiest to plot using five key x-values. These points divide one period into four equal intervals.
To find the spacing between key points, use:
Key-point spacing = Period / 4
If the period is 2π, the spacing is π/2. If the period is π, the spacing is π/4. These divisions help you place the wave accurately instead of freehanding it like a suspicious noodle.
Step 9: Find the Phase Shift
The phase shift is the horizontal movement of the graph. In the form y = A sin(Bx – C) + D, the phase shift is:
C / B
You can also find it by setting the inside expression equal to zero and solving. For example, in y = sin(x – π/3), the graph shifts right π/3. In y = cos(x + π/4), rewrite the inside as x – (-π/4), so the graph shifts left π/4.
Step 10: Mark the Starting Point of the Cycle
After finding the phase shift, mark where the cycle begins. For sine, the starting point is usually on the midline. For cosine, the starting point is usually at the maximum if A is positive or at the minimum if A is negative.
This first point anchors the rest of the graph. Without it, the wave can wander around the coordinate plane like it forgot where it parked.
Step 11: Plot the Five Key Points
Starting from the phase shift, move across the x-axis using the key-point spacing. Plot five points over one full period. For a sine graph with positive amplitude, the pattern is:
midline → maximum → midline → minimum → midline
For a cosine graph with positive amplitude, the pattern is:
maximum → midline → minimum → midline → maximum
If A is negative, flip the pattern vertically.
Step 12: Draw a Smooth Curve
Connect the five points with a smooth, continuous curve. Avoid sharp corners. Sine and cosine graphs are waves, not mountain ranges. The curve should flow naturally from one point to the next.
A good graph shows symmetry and rhythm. If your curve looks like it was drawn during turbulence, slow down and check the key points again.
Step 13: Extend the Graph Beyond One Period
Sine and cosine functions repeat forever, so you can extend the graph to the left and right by repeating the same pattern. Use the period to decide where each new cycle begins and ends.
For example, if the period is π, the graph repeats every π units. If the period is 4π, it repeats every 4π units.
Step 14: Label Important Features
A strong graph should include labels for the midline, maximum, minimum, period, and phase shift when appropriate. These labels make your work easier to understand and help prevent mistakes.
For school assignments, tests, or online tutorials, labeling also shows your reasoning. Teachers love reasoning. It is basically mathematical breadcrumbs.
Step 15: Check the Graph Against the Equation
Before calling the graph finished, compare it with the original equation. Ask these questions:
- Is the amplitude correct?
- Is the midline in the right place?
- Does one cycle have the correct period?
- Did the graph shift left or right correctly?
- Was the graph reflected if A is negative?
This final check catches most common errors. It is the math version of checking your pockets before leaving the house.
Example 1: Graph y = 2sin x
In y = 2sin x, the amplitude is 2, the period is 2π, the midline is y = 0, and there is no phase shift. The five key points are:
- (0, 0)
- (π/2, 2)
- (π, 0)
- (3π/2, -2)
- (2π, 0)
The graph looks like the parent sine graph, but it is stretched vertically. Instead of moving between -1 and 1, it moves between -2 and 2.
Example 2: Graph y = -3cos(2x) + 1
For y = -3cos(2x) + 1, the amplitude is 3, the period is 2π / 2 = π, and the midline is y = 1. Because A is negative, the cosine graph is reflected over the midline.
The maximum value is 1 + 3 = 4, and the minimum value is 1 – 3 = -2. Since the period is π, divide it into four equal parts: π/4. The graph starts at the minimum because the reflected cosine begins below the midline.
Example 3: Graph y = sin(x – π/2) – 2
In y = sin(x – π/2) – 2, the amplitude is 1, the period is 2π, the phase shift is right π/2, and the midline is y = -2.
The sine pattern begins at the point (π/2, -2). From there, it rises to the maximum, returns to the midline, falls to the minimum, and returns again. The entire wave is shifted down 2 units and right π/2.
Common Mistakes When Graphing Sine and Cosine
Confusing Amplitude With Period
Amplitude controls vertical height. Period controls horizontal length. Mixing them up is one of the most common mistakes. Remember: amplitude goes up and down; period goes left and right.
Forgetting the Absolute Value of A
The amplitude is always positive because it represents a distance. If A is negative, the graph reflects, but the amplitude remains positive.
Moving the Graph in the Wrong Direction
Phase shift can be tricky because x – h shifts the graph right, while x + h shifts it left. The sign inside the parentheses often feels backward, so solve the inside expression equal to zero if you are unsure.
Using Degrees When the Graph Uses Radians
Most algebra and precalculus sine and cosine graphs use radians. If your x-axis is labeled with π, π/2, and 2π, stay in radians. Do not suddenly invite degrees to the party unless the problem asks for them.
Why Sine and Cosine Graphs Matter
Sine and cosine functions are not just classroom decorations. They model real periodic behavior, including sound waves, tides, daylight cycles, Ferris wheel motion, alternating current, vibration, and seasonal temperature patterns. Anywhere something repeats smoothly, sine and cosine may be nearby, probably wearing tiny math sunglasses.
Learning how to graph sine and cosine functions helps you understand patterns, predict behavior, and connect equations to visual meaning. That skill becomes especially useful in physics, engineering, computer graphics, music technology, architecture, and data modeling.
Practice Problems
Try identifying the amplitude, period, midline, and phase shift for each function before graphing:
- y = 4sin x
- y = cos(3x)
- y = 2sin(x – π) + 1
- y = -cos(x + π/2)
- y = 3cos(2x) – 4
For each one, follow the same process: find the amplitude, calculate the period, identify the midline, determine the phase shift, plot five key points, and draw a smooth curve.
Real Learning Experience: What Helps Most When Graphing Sine and Cosine
One of the most helpful experiences when learning how to graph sine and cosine functions is discovering that the graph is not something you need to memorize in endless variations. Instead, every transformed graph comes from the same parent pattern. Once that idea clicks, the process becomes much more manageable.
Many students first struggle because they try to graph the entire function at once. They see y = -2sin(3x – π) + 4 and immediately feel like the equation has arrived with luggage, a passport, and a complicated backstory. A better approach is to break it into smaller decisions. What is the amplitude? What is the midline? What is the period? Is there a phase shift? Is the graph reflected? Each answer gives you one more piece of the picture.
Another useful experience is physically marking the midline first. This may sound simple, but it prevents a surprising number of mistakes. If the midline is y = 3, draw or imagine that horizontal line before plotting anything else. Then place the maximum and minimum values around it. This makes the graph feel centered and organized instead of floating randomly in coordinate space.
Students also improve quickly when they use the five-key-point method. Trying to sketch a sine or cosine graph from memory can lead to uneven waves. But plotting five points creates structure. For sine, think: middle, top, middle, bottom, middle. For cosine, think: top, middle, bottom, middle, top. These simple patterns are easier to remember than a long list of rules.
It also helps to practice with one transformation at a time. First graph functions with only amplitude changes, such as y = 3sin x. Then try period changes, such as y = sin(2x). After that, add vertical shifts and phase shifts. Building the skill gradually is like learning to drive: you do not begin on the freeway during a thunderstorm while eating soup. Start simple.
Another practical tip is to say the transformation out loud. For example: “This graph has amplitude 2, period π, midline y = -1, and shifts right π/4.” Speaking the features forces your brain to organize the equation before your pencil starts drawing. It may feel a little dramatic, but math sometimes rewards dramatic clarity.
Graphing technology can also be useful, but it should not replace understanding. A graphing calculator or online graphing tool can confirm your work, but the real learning happens when you can predict the graph before seeing it. Use technology as a coach, not as the person doing your homework while you supervise with snacks.
Finally, the best experience comes from repetition with reflection. After each graph, ask what changed compared with the parent function. Did it stretch? Compress? Move up? Shift right? Flip over? This habit turns every example into a pattern-recognition exercise. Over time, sine and cosine graphs stop looking like mysterious waves and start looking like familiar shapes with different outfits.
Conclusion
Graphing sine and cosine functions becomes much easier when you follow a reliable process. Start by identifying the parent function, then find the amplitude, period, midline, phase shift, and reflection. Plot five key points, draw a smooth curve, and check the graph against the equation. With practice, these steps turn a complicated-looking trigonometric function into a clear visual pattern.
The secret is not speed. The secret is structure. Once you understand what each part of the equation does, sine and cosine graphs become predictable, useful, and maybe even a little fun. Yes, fun. Math has its moments.