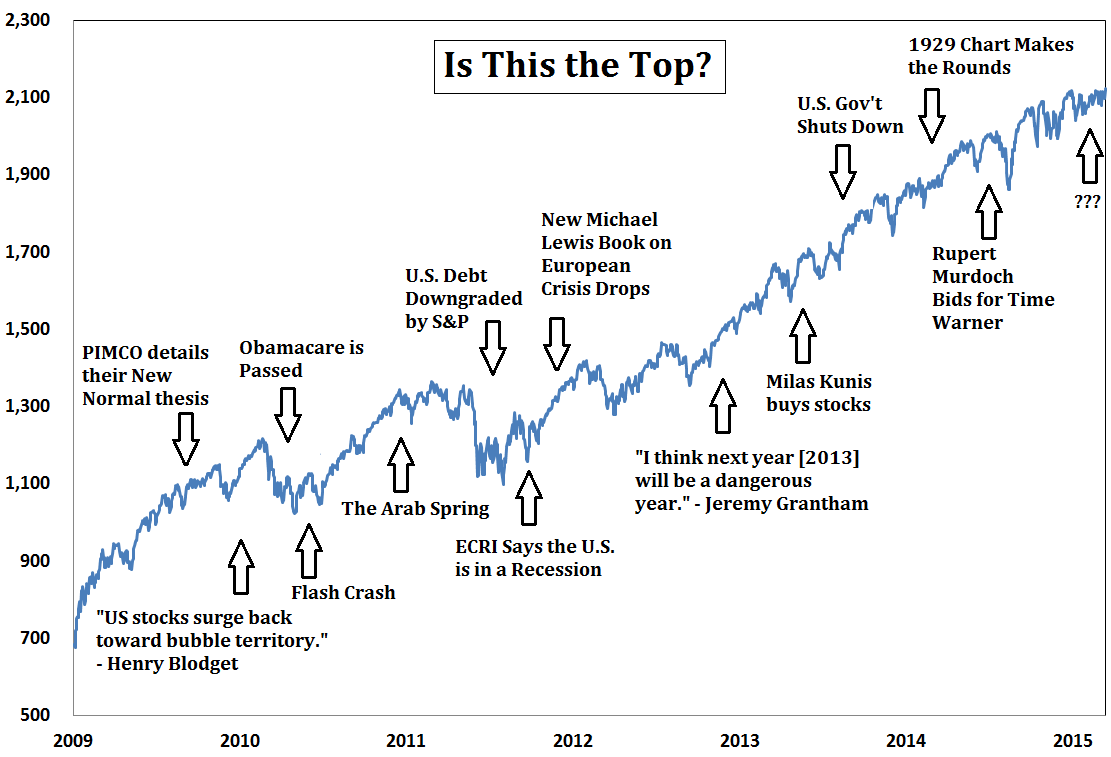

Every powerful stock-market rally eventually inspires the same nervous question: “Is this the top?” Unfortunately, market peaks do not arrive with flashing signs, dramatic music, or a polite calendar invitation. This guide explains how investors can evaluate valuations, earnings, interest rates, market breadth, economic growth, sentiment, and price trends without pretending that any single indicator can predict the future. The goal is not to identify the exact final tick. It is to recognize changing risks, avoid emotional decisions, and build a portfolio that does not depend on perfect market timing.
Why Everyone Suddenly Asks, “Is This the Top?”
A rising stock market creates an unusual emotional problem. Investors who own stocks worry about losing their gains, while investors holding cash worry about missing the next rally. One group is afraid of falling off the mountain; the other is annoyed that the mountain left without them.
The question “Is this the top?” usually becomes popular after major indexes reach record highs, valuations appear expensive, and a small number of fashionable companies dominate financial headlines. It also tends to appear after a long stretch of positive performance, when optimism begins to feel suspiciously comfortable.
That concern is understandable. Every bear market begins after a market high. However, the reverse statement is not useful: most market highs are not immediately followed by bear markets. A growing economy and rising corporate profits can push an index to one record after another.
Research from Dimensional examined more than 1,000 monthly market observations between 1926 and 2022 and found that roughly 30% were record highs. In that study, the S&P 500 was higher one year after a record about 81% of the time and higher five years later about 86% of the time. A new high, by itself, is therefore not a reliable sell signal.
A Market Top Is a Process, Not a Single Number
Investors often imagine a stock market peak as one perfect price printed at one perfect moment. In reality, tops frequently develop over weeks or months. Different sectors may peak at different times. Large technology companies may continue climbing while smaller businesses, transportation stocks, banks, or consumer companies quietly weaken underneath the surface.
A market top is best understood as a transition. Expectations become difficult to exceed, buying power becomes exhausted, economic conditions deteriorate, or investors decide that safer assets offer more attractive returns. Prices then stop responding positively to good news and begin reacting sharply to disappointment.
The actual peak is obvious only in hindsight. Financial television can identify yesterday’s top with remarkable confidence. Tomorrow’s top is apparently more camera-shy.
Three Types of Tops
A cyclical top occurs when economic growth and corporate profits begin to weaken, often before a recession or meaningful slowdown.
A valuation-driven top develops when prices rise much faster than the earnings and cash flows supporting them. The market may remain expensive for a long time, but eventually enthusiasm becomes harder to sustain.
An event-driven top can follow an unexpected shock, including a financial crisis, policy mistake, geopolitical escalation, commodity disruption, or sudden change in credit conditions.
These categories can overlap. An expensive market with slowing earnings and fragile investor confidence may be especially vulnerable to an external shock.
Seven Signals That Help Evaluate a Possible Market Top
1. Valuations Are Highand Expectations Are Even Higher
Valuation measures compare stock prices with earnings, sales, book value, cash flow, or other fundamentals. The price-to-earnings ratio is the best-known example. When investors pay more for each dollar of expected profit, future returns may become more dependent on continued growth and investor optimism.
The Federal Reserve’s May 2026 Financial Stability Report stated that the forward equity price-to-earnings ratio remained in the upper ranges of its historical distribution. The report also noted that corporate bond spreads were low by historical standards. Together, those conditions suggest that investors were assigning relatively generous prices to both stocks and corporate credit.
High valuations do not function like an alarm clock. They cannot tell investors that a decline begins next Tuesday at 10:17 a.m. Expensive markets can become more expensive, especially when earnings are rising. Valuations are more useful for estimating long-term return potential and vulnerability than for predicting a precise turning point.
Pay particular attention to what is embedded in the price. If a company is valued as though revenue, margins, and market share will rise almost flawlessly for years, merely delivering “good” results may not be enough. A perfect-looking stock can fall because the results were excellent rather than miraculous.
2. Earnings Growth Begins to Lose Momentum
Stock prices ultimately need support from corporate earnings and cash flow. A market can absorb high valuations more easily when profits are growing quickly. Trouble may develop when prices continue rising while earnings estimates flatten or fall.
Investors should examine more than headline earnings. Revenue growth, operating margins, free cash flow, guidance, and estimate revisions can reveal whether business momentum is improving or deteriorating.
A particularly important warning appears when companies repeatedly beat reduced expectations while issuing cautious guidance. The headlines may sound positive, but the underlying trend can resemble someone proudly clearing a hurdle after quietly lowering it six inches.
One disappointing quarter does not define a market top. A broader pattern of downward estimate revisions across multiple sectors is more significant.
3. Market Breadth Becomes Narrow
Market breadth measures how many stocks are participating in a rally. A healthy advance usually includes numerous industries and company sizes. A narrow rally occurs when a handful of giant companies pull an index higher while the average stock struggles.
Because major indexes such as the S&P 500 are weighted by market capitalization, the largest companies have the greatest influence. An index can look strong even when many individual stocks have already entered corrections.
Useful breadth indicators include:
- The percentage of stocks trading above their 50-day and 200-day moving averages
- The number of stocks reaching new highs versus new lows
- The performance of equal-weighted indexes compared with capitalization-weighted indexes
- The relative strength of small-cap and mid-cap stocks
- Advance-decline data across major exchanges
Narrow leadership is not an automatic crash signal. Strong companies can dominate for valid reasons, including superior profitability and innovation. However, a rally supported by fewer and fewer stocks has less room for error. If the leaders stumble, there may be no bench waiting to enter the game.
4. Interest Rates Challenge Stock Valuations
Interest rates influence the value of future corporate cash flows and determine what investors can earn from bonds and cash. When Treasury yields rise, high-quality fixed-income investments may become more competitive with stocks.
Higher rates can also increase borrowing costs for households and businesses. Companies refinancing debt may face larger interest expenses, while consumers may reduce spending on homes, vehicles, and other financed purchases.
The relationship is not mechanical. Stocks can rise alongside interest rates when yields are increasing because economic growth is strong. The more concerning combination is rising rates, stubborn inflation, weakening growth, and declining profit expectations.
Investors should therefore ask why rates are movingnot merely whether they are moving.
5. Economic Data Begin to Deteriorate Broadly
The stock market is not the economy, but the two eventually meet through sales, employment, credit, and earnings. No single report proves that a business-cycle peak has arrived.
The National Bureau of Economic Research defines a recession as a significant decline in economic activity that is spread across the economy and lasts more than a few months. Its process considers depth, diffusion, and duration rather than relying only on two negative quarters of gross domestic product.
As of the third estimate released in June 2026, real U.S. GDP had increased at a 2.1% annual rate during the first quarter. Meanwhile, the Consumer Price Index was 3.5% higher in June 2026 than a year earlier. That combination described continued growth alongside inflation that remained relevant to monetary policynot a simple “everything is wonderful” or “recession is here” message.
To evaluate economic risk, watch groups of indicators:
- Employment growth and unemployment claims
- Real consumer spending and personal income
- Industrial production and manufacturing activity
- Bank lending standards and delinquency rates
- Housing activity and building permits
- Inflation trends and wage growth
A true warning emerges when weakness spreads rather than remaining isolated in one report or industry.
6. Investor Sentiment Turns Euphoric
Strong markets naturally produce optimism. Euphoria is different. It encourages investors to believe that risk has disappeared, valuation no longer matters, and every decline is merely a convenient opportunity to buy something with a rocket emoji in its name.
Possible signs of excessive enthusiasm include speculative trading surges, aggressive use of leverage, unrealistic profit claims, extreme fund flows, indiscriminate initial public offering demand, and widespread fear of missing out.
The VIX is often called Wall Street’s “fear gauge.” It uses S&P 500 options prices to reflect the market’s expectation of volatility over approximately the next 30 days. However, a low VIX does not guarantee a top, and a high VIX does not guarantee a bottom. It measures expected volatility, not destiny.
Sentiment indicators are most useful when combined with valuation, breadth, credit, and earnings data. Optimism supported by improving profits is different from optimism supported by a group chat and a screenshot of someone else’s gains.
7. The Market Stops Responding to Good News
Price reaction can reveal more than the news itself. During a strong bull market, investors may dismiss disappointing data and reward positive surprises. Near a vulnerable phase, the pattern can reverse.
A company may report strong earnings and still decline. An encouraging inflation report may produce only a brief rally. Favorable policy news may fail to lift economically sensitive sectors. Repeated failures to hold gains can indicate that buyers are becoming less aggressive.
Technical analysts may watch lower highs, breaks below long-term moving averages, increasing downside volume, or failed attempts to recover previous records. None of these indicators is perfect. Together, however, they may show that the market’s character is changing.
Popular “Top Signals” That Often Mislead Investors
A Record High
A record high means the market has risen above its previous record. That is all. Since successful companies grow and the economy expands over long periods, indexes must repeatedly reach new highs to deliver long-term gains.
One Expensive Valuation Metric
Valuation measures use different assumptions and time periods. A high price-to-earnings ratio may partly reflect unusual earnings conditions, sector composition, low capital requirements, or expected growth. It deserves attention, not blind obedience.
A Famous Investor Holding Cash
Large institutions operate under different constraints from individual investors. Their cash positions may reflect acquisition plans, liquidity needs, tax considerations, or a shortage of opportunities large enough to affect the portfolio. Copying one visible position without understanding the full strategy is risky.
A Dramatic Prediction
Predictions receive attention because certainty is entertaining. “Stocks may rise, fall, or wander around depending on future information” is more accurate, but it rarely earns a television countdown clock.
Before acting on a forecast, examine the forecaster’s complete record rather than the one prediction currently circulating online.
What Should Long-Term Investors Do Near Market Highs?
Review the Plan Before Reviewing the Headlines
Your investment horizon, financial goals, cash needs, and risk tolerance matter more than a commentator’s market target. Money needed for a home purchase next year should not carry the same risk as retirement money intended for use decades from now.
Rebalance Instead of Making an All-or-Nothing Bet
A long rally may increase a portfolio’s stock allocation beyond its intended target. Rebalancing sells part of the overweight asset class and reallocates the proceeds according to the original plan.
This approach manages risk without requiring an investor to declare that the exact market top has arrived. It replaces fortune-telling with arithmetic, which is less exciting but generally more dependable.
Maintain Diversification
Diversification across sectors, company sizes, regions, and asset classes reduces dependence on one market narrative. It cannot eliminate losses, but it can prevent a single fashionable theme from becoming the entire financial plan.
The SEC and FINRA consistently emphasize matching asset allocation to goals and risk tolerance. FINRA also warns that market timing requires investors to make multiple correct decisions: when to sell, where to hold the proceeds, and when to buy again.
Use Gradual Investing When Emotion Is the Main Obstacle
An investor with a large amount of cash may feel uncomfortable investing it near a record high. Investing in scheduled stages can reduce the emotional pressure of choosing one entry point.
Dollar-cost averaging does not guarantee a profit or protect against loss. If the market continues rising, investing immediately may produce a better result. The practical benefit of gradual investing is behavioral: it can help a nervous investor begin following a plan instead of remaining permanently frozen.
Avoid Selling Everything Based on a Question
Moving entirely to cash creates a second problem. Even if the sale occurs before a decline, the investor must decide when to return. Recoveries can begin while economic news still looks terrible, and some of the market’s strongest days occur near its weakest days.
FINRA, Investor.gov, Fidelity, Schwab, Vanguard, and other investor-education organizations repeatedly warn about the difficulty of short-term market timing. Time in the market is not a magical guarantee, but repeatedly jumping in and out can turn normal uncertainty into permanent underinvestment.
A Practical Market-Top Checklist
Instead of demanding a yes-or-no prediction, score the environment across several categories:
- Valuation: Are prices high relative to realistic earnings and cash-flow expectations?
- Earnings: Are estimates rising, stable, or being revised lower?
- Breadth: Is the average stock participating in the rally?
- Credit: Are corporate borrowing conditions stable or deteriorating?
- Rates: Are yields rising because of healthy growth or persistent inflation?
- Economy: Is weakness spreading across employment, spending, production, and housing?
- Sentiment: Are investors confident, complacent, or openly euphoric?
- Trend: Does the market continue making higher highs and higher lows?
- Personal risk: Would a 20% or 30% decline disrupt your financial life?
If only one indicator appears concerning, the evidence for a major market top is weak. If several indicators deteriorate together, risk may be increasing. Even then, the appropriate response is usually thoughtful portfolio management rather than a dramatic all-cash escape.
Experience-Based Lessons From Asking, “Is This the Top?”
The following is a composite of common investor experiences across multiple market cycles rather than a claim of personal trading history.
The first experience is that market tops feel obvious only after prices have already fallen. During the advance, every warning has a reasonable counterargument. Valuations may be expensive, but earnings are growing. Leadership may be narrow, but the leaders are exceptional businesses. Interest rates may be high, but the economy remains resilient. There is always enough uncertainty to keep both optimists and pessimists employed.
The second experience is that selling creates immediate emotional relief. An investor who moves to cash no longer worries about tomorrow’s decline. For a few days, this can feel like wisdom. Then the market rises another 5%, and relief becomes regret. The investor waits for a pullback. When a 3% decline finally appears, it does not seem large enough. When a 10% correction arrives, the headlines are frightening enough to make buying feel irresponsible.
The investor who sold to avoid uncertainty discovers that cash did not eliminate decision-making. It doubled it.
The third lesson is that portfolio concentration often hides during a rally. Suppose an investor starts with a diversified portfolio but repeatedly adds to the best-performing technology stocks. As those holdings rise, they become a larger percentage of total assets. The investor feels diversified because several ticker symbols appear on the screen, yet the companies may depend on the same economic themes, customer spending patterns, interest-rate assumptions, or enthusiasm for artificial intelligence.
When that theme weakens, multiple positions fall together. The surprise is not that volatile stocks declined. The surprise is that the portfolio contained fewer independent ideas than the investor believed.
A fourth recurring experience involves confusing a good company with a good price. A business may have excellent management, durable competitive advantages, growing revenue, and strong cash flow. None of those strengths guarantees that the stock will perform well from every valuation. If expectations already assume years of exceptional execution, ordinary excellence can disappoint the market.
The fifth lesson is that corrections feel different in real time than they look on historical charts. A completed chart compresses months of uncertainty into a neat downward line followed by a recovery. Living through the decline means experiencing each earnings warning, policy announcement, analyst downgrade, and alarming headline one day at a time. The future recovery is invisible.
That is why a written plan matters. An investor who decides in advance how much stock exposure is appropriate, when to rebalance, and how much emergency cash to hold is less dependent on courage during a crisis. The plan makes difficult decisions while conditions are calm.
Another common experience is waiting for certainty before investing. Unfortunately, markets often recover before the economy looks healthy. By the time recession risks disappear, earnings stabilize, inflation behaves, and commentators become optimistic again, prices may already be substantially higher.
The most durable lesson is not that investors should ignore risk. It is that risk should be managed structurally. Diversification, position limits, appropriate cash reserves, reasonable expectations, and periodic rebalancing can prepare a portfolio for an uncertain future. Predicting the exact top attempts to solve uncertainty with one perfect decision. Building a resilient portfolio accepts that perfect decisions are unavailable.
Asking “Is this the top?” can still be useful when it leads to better questions: Am I taking more risk than I intended? Have rising prices distorted my asset allocation? Am I relying on one sector or narrative? Will I need this money soon? Would a normal bear market cause me to abandon my strategy?
Those questions are less dramatic than calling a historic peak. They are also more likely to improve an investor’s outcome.
Conclusion: Is This Really the Top?
It might be. It might also be one of many temporary highs in a longer advance. No valuation ratio, economic release, sentiment survey, volatility index, or chart pattern can identify the final market peak consistently.
The strongest analysis combines several forms of evidence. Expensive valuations become more concerning when earnings estimates decline. Narrow breadth matters more when credit conditions tighten. High interest rates become more threatening when economic growth weakens. Euphoria becomes more dangerous when investors abandon diversification and increase leverage.
For most long-term investors, the better objective is not selling at the exact top. It is holding a portfolio that can survive being wrong. Review your allocation, reduce unintended concentration, preserve near-term cash needs, rebalance when appropriate, and avoid building a financial future that requires flawless market timing.
The market will eventually fall from a high. It will also eventually reach another one. Your strategy should be prepared for both.
SEO Metadata