
A Raspberry Pi spectrometer sounds like the sort of gadget that should live somewhere between a science fair table and a suspiciously smoky garage experiment. Yet the modern Pi-based spectrometer has grown into something far more useful: an affordable, open-source optical instrument that can capture, calibrate, and analyze spectra with surprising seriousness. The upgrade story is especially interesting because it shows what happens when inexpensive hardware meets better software, smarter calibration, and the maker community’s favorite fuel: “I bet I can build that cheaper.”
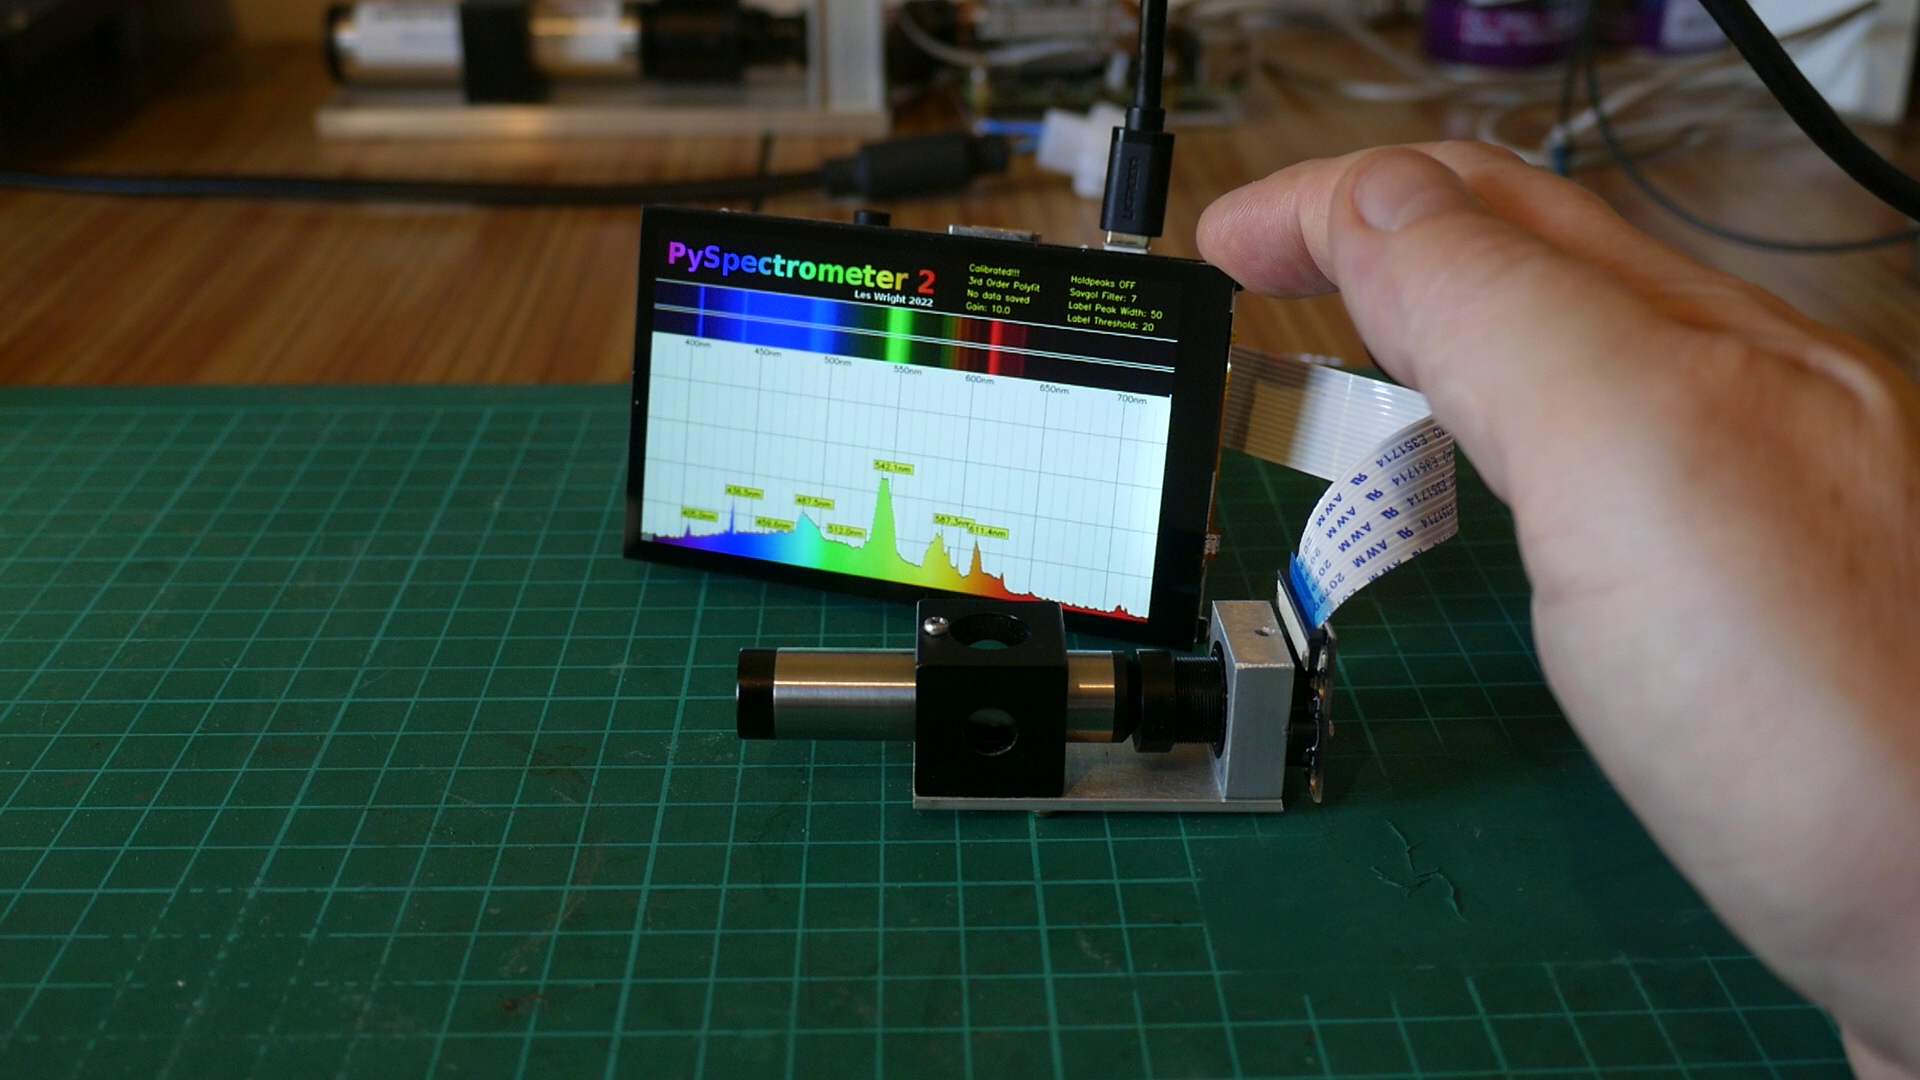
At the center of this story is the upgraded PySpectrometer2 project, a Raspberry Pi spectrometer that moved beyond its earlier educational roots and became a more flexible tool for visible-light spectroscopy. The project uses a Raspberry Pi camera, optical components such as a diffraction grating or spectroscope, and Python-based image processing to turn lines of colored light into wavelength data. In plain English, it teaches a tiny computer to read rainbows with a clipboard.
This upgrade matters because spectrometers are not just fancy lab jewelry. They are used to identify materials, study light sources, examine fluorescence, calibrate optical systems, and teach students how light interacts with matter. Commercial instruments can cost hundreds, thousands, or much more. A Pi-based spectrometer does not replace every professional lab device, but it lowers the entry barrier dramatically. That makes it valuable for classrooms, hobby labs, citizen science, and curious engineers who cannot resist pointing a camera at a glowing thing.
What Is a Pi-based Spectrometer?
A Pi-based spectrometer is an optical spectrometer built around a Raspberry Pi single-board computer. Instead of using a specialized detector array and expensive proprietary software, it often relies on a Raspberry Pi camera module, a slit, a lens, and a diffraction grating or commercial pocket spectroscope. Light enters through a narrow slit, spreads into its component wavelengths, and lands on the camera sensor as a colored spectrum. Software then measures the position and brightness of that spectrum and converts pixel positions into wavelengths.
The key idea is simple but brilliant: a camera already records pixels, and each pixel has a location and intensity. If the optical path is stable and calibrated, the software can map a pixel column to a wavelength. A bright peak might correspond to a laser line, an emission line from a lamp, or a fluorescence response from a sample. The Raspberry Pi handles capture, display, calibration, logging, and export. It is part camera, part calculator, part lab assistant, and part tiny overachiever.
How the Optical Setup Works
Most low-cost spectrometers follow the same basic optical recipe. A narrow slit controls the incoming beam of light. A collimating lens helps straighten that light. A diffraction grating separates the light by wavelength. A camera or sensor records the separated spectrum. The narrower and cleaner the slit, the better the spectral resolution tends to be, although less light reaches the camera. In spectrometer design, there is always a trade-off: open the slit too much and resolution gets mushy; close it too much and the signal sulks in the dark.
Diffraction gratings are the star of the show. They split light into wavelength-dependent angles, allowing a camera sensor to see different wavelengths in different positions. This is the same broad principle behind many professional spectrographs, though professional instruments add precision optics, careful thermal control, validated calibration, and detectors designed for specific spectral ranges.
The Upgrade: From Fun Demo to Serious Maker Instrument
The original Raspberry Pi spectrometer project already had a strong appeal: it used accessible components and Python software to create a practical, low-cost optical instrument. But software ecosystems change. Raspberry Pi OS Bullseye introduced camera stack changes that affected older projects relying on legacy camera behavior. Instead of merely patching around the breakage, the upgraded PySpectrometer2 took the opportunity to rethink the software architecture.
The result is more than a compatibility update. The newer version emphasizes OpenCV-based image processing, improved calibration, cleaner operation, and more useful visualization. The project’s upgrade shows a useful lesson for any DIY scientific tool: hardware may get the spotlight, but software determines whether the device feels like a toy, a teaching aid, or an instrument you can actually trust for repeated measurements.
OpenCV Makes the Spectrometer Smarter
OpenCV is a natural fit for a camera-based spectrometer because spectroscopy becomes an image-processing problem once the spectrum lands on the sensor. The software can crop a region of interest, extract intensity values along the spectral axis, smooth noisy data, detect peaks, and display results in real time. Instead of staring at a pretty rainbow and saying, “Yep, that is definitely rainbow-ish,” the program can quantify what it sees.
Using OpenCV also makes the application more maintainable and portable than a stack held together with too many fragile dependencies. For a maker project, that matters. A project that works only on one old operating system image is a museum exhibit. A project that can evolve with modern camera APIs has a future.
Multi-wavelength Calibration Improves Accuracy
One of the biggest improvements in the upgraded Pi-based spectrometer is multi-wavelength calibration. Older simple spectrometer builds often use one or two known points to map pixels to wavelengths. That can work across a narrow range, but optical geometry is not always perfectly linear. Lenses, gratings, camera angles, and sensor placement can introduce curvature in the relationship between pixel position and wavelength.
PySpectrometer2 improves this by using multiple known wavelength references and a polynomial regression fit. In practical terms, the software learns a curve rather than pretending the world is a straight line. This helps reduce wavelength error across the measured range and gives the system a more professional feel. The reported ability to resolve wavelengths around plus or minus one nanometer is impressive for a low-cost, camera-based project, especially when the alternative is usually “buy a commercial unit and apologize to your wallet.”
Why Calibration Is the Real Hero
Calibration is what separates a useful spectrometer from a colorful light toy. A spectrum image by itself is just a bright stripe on a sensor. Calibration tells the software that this pixel position corresponds to this wavelength. Without calibration, a peak is only “somewhere over there.” With calibration, it becomes data.
Common calibration sources include known laser pointers, gas discharge lamps, fluorescent lamps, and other light sources with identifiable spectral lines. For higher precision work, laboratories use certified wavelength references and carefully documented procedures. A DIY spectrometer will not magically become a national metrology lab, but borrowing the mindset of professional calibration makes the measurements more reliable.
Polynomial Fitting in Everyday Terms
Polynomial regression sounds intimidating until you imagine taping a flexible ruler onto a slightly curved surface. A straight ruler does not fit perfectly, but a flexible one follows the shape better. In a spectrometer, polynomial fitting lets the software create a flexible mathematical relationship between camera pixels and wavelengths. This is especially helpful when the spectrum is not spread perfectly evenly across the sensor.
For users, the benefit is straightforward: better wavelength readings across the whole visible range, not just near one calibration point. That is important when comparing different light sources, checking emission peaks, or tracking changes in a spectrum over time.
The Waterfall Display: Watching Spectra Change Over Time
Another useful upgrade is the waterfall display. A standard spectrum graph shows intensity versus wavelength at one moment. A waterfall display stacks spectra over time, allowing users to see how peaks appear, disappear, shift, or brighten. It is like time-lapse photography for light data, minus the cinematic soundtrack and dramatic narrator.
This feature is particularly useful for experiments involving changing light sources, fluorescence decay, warming LEDs, chemical reactions that alter color, or alignment adjustments. Instead of saving separate screenshots and playing detective later, the user can watch spectral behavior unfold in a single visual timeline.
Examples of What a Waterfall View Can Reveal
Imagine testing an LED as it warms up. The spectrum may shift slightly as temperature changes. Or consider monitoring fluorescence after shining excitation light on a sample. Some peaks may fade faster than others. A waterfall display makes these changes easier to spot. It does not turn a Raspberry Pi into a magic tricorder, but it gives users a much better way to observe dynamic behavior.
Hardware: Simple Parts, Serious Possibilities
The appeal of a Pi-based spectrometer is that the hardware can be surprisingly approachable. A typical build may use a Raspberry Pi, a compatible camera, an adjustable-focus or M12 lens, a diffraction grating or compact spectroscope, and a rigid base or enclosure. The enclosure is not just for looks. It blocks stray light, protects alignment, and prevents every desk lamp in the room from joining the experiment uninvited.
Raspberry Pi camera modules have also improved over time. Camera Module 2 offers an 8-megapixel Sony sensor with adjustable focus, while Camera Module 3 provides a 12-megapixel sensor, powered autofocus, and longer exposure capability. NoIR camera variants remove the infrared filter, which can be useful for experiments that benefit from sensitivity beyond visible-only imaging. For spectroscopy, the best camera choice depends on the wavelength range, optical design, exposure control, and how much manual control the software can exercise.
Why Stability Matters
A spectrometer is only as reliable as its alignment. If the grating, lens, slit, or camera moves between calibration and measurement, the wavelength map can drift. That is why rigid mounting matters. Aluminum rails, 3D-printed holders, carefully glued parts, and light-tight boxes may not sound glamorous, but they are the difference between repeatable data and a device that changes personality every time someone sneezes near it.
Software Compatibility and the Raspberry Pi Camera Stack
Raspberry Pi camera software has shifted from older legacy tools toward libcamera and Picamera2. This is good for long-term camera support, but it can break older projects that were built around previous APIs. The PySpectrometer upgrade is a good example of how open-source scientific tools must adapt when operating systems evolve.
Picamera2 is built on top of libcamera and provides a Python-friendly way to access Raspberry Pi camera hardware. For future spectrometer projects, that matters because Python remains the natural language for many maker-science builds. Python connects camera capture, image processing, calibration math, plotting, file export, and user interface logic without demanding a corporate software budget or a ritual sacrifice to the dependency gods.
What Can You Use a Pi-based Spectrometer For?
A Pi-based spectrometer is ideal for education and experimentation. Students can compare incandescent bulbs, LEDs, fluorescent lamps, neon signs, laser pointers, sunlight, and filtered light. Instead of memorizing that different sources have different spectra, they can see the difference directly. The lesson becomes visual, measurable, and far less likely to put the classroom into a collective nap.
Hobbyists can use the device to examine laser wavelengths, study fluorescence, compare plant grow lights, inspect optical filters, or learn the fundamentals of spectral analysis. Makers interested in chemistry, astronomy, photography, horticulture, electronics, or optics can all find uses for a low-cost spectrometer. It is not a replacement for a certified analytical laboratory instrument, but it is an excellent bridge between curiosity and measurement.
Specific Example: Comparing Light Sources
Point the spectrometer at an incandescent bulb and you will typically see a broad, continuous spectrum. Aim it at certain LEDs and you may see strong peaks or shaped bands depending on the LED design and phosphor mix. Look at a fluorescent lamp and emission lines become more obvious. These comparisons help explain why two “white” lights can look different to cameras, plants, and human eyes.
Specific Example: Checking a Laser Pointer
A laser pointer should produce a narrow spectral peak around its rated wavelength, such as red near 650 nm or green near 532 nm. A calibrated Pi-based spectrometer can help verify where that peak appears. Safety comes first, of course: never point lasers into eyes, reflective surfaces, or directly into a camera sensor at high power. The spectrometer may be brave, but your retinas did not sign a waiver.
Limitations You Should Understand
A Pi-based spectrometer is powerful for the price, but it has limitations. Resolution depends on slit width, grating quality, lens focus, camera pixel size, optical alignment, and calibration quality. Sensitivity depends on the camera sensor, exposure settings, noise, and how much light reaches the detector. Stray light can contaminate results. Auto-exposure and auto-white-balance can distort intensity measurements if they are not controlled or disabled.
Users should also avoid overclaiming. Measuring relative spectral shape is different from making certified radiometric measurements. Identifying peaks is different from quantifying chemical concentration. A low-cost spectrometer can teach, compare, explore, and prototype beautifully, but serious analytical work requires validated methods, known standards, uncertainty estimates, and appropriate safety procedures.
Best Practices for Better Results
Use a stable mount. Block stray light. Calibrate with multiple known wavelengths. Keep exposure settings consistent. Record your setup. Recalibrate after moving hardware. Avoid saturating the camera sensor. Export data for analysis instead of relying only on screenshots. When possible, repeat measurements and compare results. Science likes repetition; it is clingy that way.
Why This Upgrade Is Important for Open-source Science
The upgraded Pi-based spectrometer is part of a larger movement toward open-source instrumentation. Affordable computing, 3D printing, accessible sensors, and public software libraries have changed what individuals and classrooms can build. Ten years ago, a spectrometer might have felt like equipment reserved for universities and industrial labs. Today, a determined maker can build a functional version on a desk, calibrate it, and learn real optical analysis.
This does not make professional instruments obsolete. Instead, it creates a wider on-ramp. Students can learn with low-cost tools before using advanced lab equipment. Researchers can prototype custom measurement setups. Hobbyists can explore spectroscopy without taking out a small loan. Teachers can turn abstract physics into visible data. That is the real upgrade: not just better software, but better access.
Experience Notes: Working With a Pi-based Spectrometer in the Real World
Building or using a Pi-based spectrometer is wonderfully educational because it teaches humility at approximately the speed of light. On paper, the project looks simple: slit, grating, camera, software. In practice, every tiny detail matters. The slit needs to be straight and narrow. The camera must focus sharply on the spectrum. The grating angle has to be stable. The enclosure must block stray light. The calibration source must be reliable. Suddenly, the innocent-looking rainbow on your screen starts behaving like a tiny optical diva.
One of the first experiences many users have is discovering that brightness is not the same as accuracy. It is tempting to increase exposure until the spectrum looks bold and colorful, but saturated pixels destroy useful intensity information. A peak that clips at the top is no longer a measurement; it is the camera shouting, “That is all I can take!” A better approach is to lower exposure, reduce gain, or dim the source so the brightest peaks stay below saturation.
Another common lesson is that calibration should not be treated as a one-time ceremony. If the camera shifts, the lens is refocused, the grating is nudged, or the enclosure is opened and reassembled, the pixel-to-wavelength relationship may change. Recalibration is not busywork. It is the instrument’s way of asking, politely but firmly, “Are we still measuring the same thing?” Keeping a calibration log helps a lot, especially when comparing data from different sessions.
Light control is also more important than beginners expect. A spectrometer is designed to measure light, which means it will happily measure light you did not intend to include. Room lights, monitor glow, sunlight through a window, and reflections from shiny tools can all sneak into the data. A dark enclosure, matte black interior surfaces, and careful sample positioning can improve results dramatically. In DIY spectroscopy, black tape is not a hack; it is practically a research assistant.
Data export is another turning point. The project becomes much more useful when users stop treating the display as the final result and start saving intensity-versus-wavelength data. CSV files can be opened in spreadsheet software, Python notebooks, or graphing tools. This makes it easier to compare spectra, measure peak positions, subtract background signals, and document experiments. A screenshot says, “Look what I saw.” A data file says, “Let’s analyze what happened.”
Finally, the best experience with a Pi-based spectrometer comes from using it as both a tool and a teacher. It teaches optics through alignment, programming through image processing, statistics through calibration, and scientific discipline through repeatability. It rewards patience and punishes sloppy setup, but in a friendly way. When the first clean peak lands exactly where the calibration says it should, the project feels less like a budget gadget and more like a small laboratory victory. That moment is why this upgrade is exciting: it turns a Raspberry Pi, a camera, and some carefully arranged optics into a practical doorway into spectroscopy.
Conclusion
The upgraded Pi-based spectrometer proves that affordable science tools can be far more capable than their price tags suggest. By combining Raspberry Pi hardware, camera-based optical capture, OpenCV processing, multi-wavelength calibration, polynomial fitting, and a waterfall display, PySpectrometer2 moves from “cool educational build” toward “serious open-source instrument.” It is not meant to replace every commercial spectrometer, and users should respect its limits. But for learning, experimenting, prototyping, and exploring the hidden fingerprints of light, it is an impressive example of maker engineering done right.
Most importantly, the project shows how upgrades should happen. It does not merely patch old code and hope nobody notices the duct tape. It improves accuracy, usability, visualization, and maintainability. For students, teachers, hobbyists, and open-source science fans, that is worth celebrating. After all, any project that lets a Raspberry Pi read rainbows with better manners deserves a little applause.