
Most programmers begin life in the cozy living room of high-level code. Variables have names. Functions have manners. Loops look like loops. Then one day, a bug walks in wearing steel-toed boots, performance falls through the floor, or a compiler optimization turns your “obvious” line of C into something that looks like an alien receipt. That is when source code to assembly mapping suddenly becomes less like optional nerd trivia and more like a flashlight in a basement.
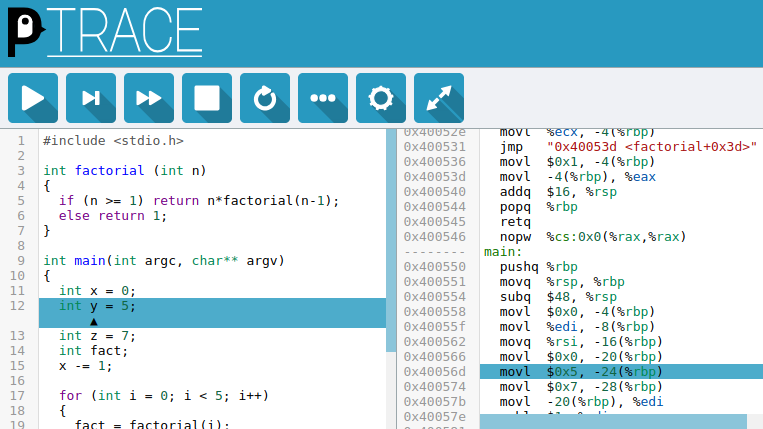
PenguinTrace is built for that exact moment. It helps developers examine how source code maps to assembly instructions and how those instructions execute on real hardware-level concepts such as registers, memory, and control flow. Instead of staring at a disassembly dump and whispering “what fresh nonsense is this,” you get a clearer side-by-side view of code and machine instructions. For students, systems programmers, embedded developers, compiler-curious engineers, and anyone who has ever wondered what the CPU actually does after the semicolon, PenguinTrace is a friendly doorway into the lower levels of software.
This article explores what PenguinTrace does, why source-to-assembly mapping matters, how it compares with traditional tools such as objdump, GDB, LLVM objdump, Compiler Explorer, and DWARF-aware debuggers, and how to use it as part of a practical learning or debugging workflow. We will keep things technical, useful, and just slightly less dry than a processor manual left in the Arizona sun.
What Is PenguinTrace?
PenguinTrace is a Linux-oriented tool designed to show how code runs at the hardware level. It provides a web interface where users can write or edit code, compile it, view the resulting assembly, and step through execution while watching values change. In plain English, it acts like a microscope for compiled code. You write source code on one side, and PenguinTrace helps reveal the assembly instructions that the compiler generated on the other.
The key value is not merely “look, assembly!” Many tools can dump assembly. PenguinTrace focuses on the relationship between the original source and the generated instructions. That relationship is where real understanding begins. A single C statement might become one instruction, several instructions, or no visible instruction at all if the compiler optimizes it away. A simple function call might involve register setup, stack alignment, jumps, return addresses, and calling convention rules. PenguinTrace makes those invisible mechanics easier to follow.
Why Source Code To Assembly Mapping Matters
Source code is written for humans. Assembly is closer to what the processor executes. The compiler stands in the middle, translating intent into machine-level operations. Usually, that translation is trustworthy enough that developers can ignore it. But “usually” is not the same as “always,” and performance bugs love hiding in the gap between intention and execution.
Mapping source code to assembly helps developers answer practical questions:
- Did the compiler optimize this loop?
- Was this variable stored in a register or on the stack?
- Why did this function call create so much instruction overhead?
- How are parameters passed on this architecture?
- What instructions are generated by a branch, pointer access, or arithmetic expression?
- Why does the debugger jump strangely between lines?
These questions matter in systems programming, embedded development, performance tuning, reverse engineering education, compiler study, security research, and computer architecture courses. Even web developers benefit from the mental model. Once you understand that high-level code eventually becomes load, store, compare, jump, call, and return operations, software stops feeling magical and starts feeling mechanical. Magic is fun; mechanics are debuggable.
How PenguinTrace Helps You See The Translation
The typical PenguinTrace workflow is refreshingly direct. You enter C, C++, or assembly code in the browser-based interface, compile it, and inspect the assembly output. The interface highlights the active source line and the corresponding assembly instruction as the program runs. You can step through execution and observe changes in registers and variables.
This interaction is important. Static assembly output can teach you what a compiler generated, but stepping through the code teaches you what the program is doing. For example, the line:
might involve moving values into registers, performing an add instruction, and storing the result. On x86-64, you may see registers such as rax, rbx, rdi, or rsi. On AArch64, you may see registers such as x0, x1, or w0. The point is not to memorize every register immediately. The point is to watch source-level intent become instruction-level action.
PenguinTrace Versus Traditional Disassembly Tools
PenguinTrace does not exist in a vacuum. Developers have long used tools such as objdump, gdb, llvm-objdump, and Compiler Explorer to inspect compiled code. Each tool has a place.
Objdump
objdump is a classic binary inspection tool. It can disassemble object files and executables, show sections, display symbols, and intermix source with assembly when debug information is available. It is powerful, scriptable, and dependable. It is also about as friendly as a parking meter. If you already know what you are looking for, objdump is excellent. If you are learning, its output can feel like being handed an aircraft engine and told, “Good luck, pilot.”
GDB
GDB can display machine code, disassemble functions, map source lines to addresses, and step through programs instruction by instruction. It is one of the most important debugging tools in Unix-like development. However, GDB is command-driven and deep. That depth is wonderful for professionals but intimidating for learners. PenguinTrace offers a more visual and focused path into the same conceptual territory.
LLVM Objdump
llvm-objdump provides similar object-file inspection capabilities in the LLVM ecosystem. It supports disassembly and source line display options, making it useful when working with Clang or LLVM-based workflows. Like GNU objdump, it is excellent for analysis but less beginner-friendly than a guided interface.
Compiler Explorer
Compiler Explorer is famous for showing how source code compiles into assembly across many languages, compilers, versions, and optimization levels. It is ideal for comparing output and experimenting quickly. PenguinTrace differs by emphasizing execution tracing: not just what was generated, but how it runs step by step.
The Role Of Debug Information And DWARF
Source-to-assembly mapping often depends on debug information. In many Linux and Unix-like toolchains, that means DWARF. DWARF is a debugging information format used by compilers and debuggers to describe source files, line numbers, variables, types, function boundaries, stack frames, and more. Without debug metadata, a tool may still disassemble instructions, but it has a harder time connecting those instructions back to the original source code.
This is why compiling with options such as -g matters when using debuggers and source-aware disassembly. The compiler emits extra information that helps tools understand where instructions came from. That does not mean the mapping is always perfect. Optimized builds can reorder instructions, inline functions, remove variables, or merge operations. The compiler is not lying; it is just being aggressively clever, like a raccoon with a PhD.
Why Optimization Makes Mapping More Interesting
At low optimization levels, source code often maps more directly to assembly. At higher optimization levels, the compiler starts transforming code for speed, size, or architecture-specific efficiency. That is when things get spicy.
Consider a simple loop:
With minimal optimization, you might see instructions for initializing sum, initializing i, comparing i with 10, branching back to the loop, and adding each value. With stronger optimization, the compiler may realize the result is constant and replace the entire loop with a single value. Congratulations: your loop went to compiler heaven.
PenguinTrace is useful because it lets learners observe these differences. Change the code. Change optimization settings if available in your workflow. Compare the instruction output. Ask why instructions disappeared, moved, or multiplied. This is how assembly stops being a wall of cryptic mnemonics and becomes a translation you can reason about.
Understanding Registers Through PenguinTrace
Registers are tiny storage locations inside the CPU. They are much faster to access than memory, and compilers try to use them heavily. When you examine assembly, many operations involve moving values into registers, operating on them, and moving results elsewhere only when necessary.
For example, a function like this:
may compile into only a few instructions. Depending on the architecture and calling convention, the arguments may arrive in registers, the addition may happen in a register, and the return value may also be placed in a designated register. Seeing this in PenguinTrace helps explain why function calls are not merely abstract boxes. They follow rules defined by the platform ABI, including where arguments go, where return values appear, and which registers must be preserved.
Source Lines Are Not Always Instruction Lines
One of the most important lessons in source-to-assembly mapping is that one source line does not always equal one assembly instruction. Sometimes one source line becomes many instructions. Sometimes several source lines contribute to one instruction sequence. Sometimes a source line vanishes because the compiler proves it unnecessary.
This matters when debugging. A programmer might set a breakpoint on a line and expect the CPU to pause at a neat little boundary. But the processor does not execute C lines. It executes instructions at addresses. Debuggers create the illusion of source-level stepping by using debug information to map addresses back to lines. That illusion is useful, but it can become fuzzy in optimized code.
PenguinTrace helps make this visible. When students see the highlighted source and assembly together, they can understand why stepping sometimes feels strange. The debugger is not haunted. It is translating between two different worlds.
A Practical Example: Branching
Take a small conditional:
At the assembly level, this may become a comparison instruction followed by a conditional branch, or it may become branchless code using conditional move instructions depending on the compiler and architecture. PenguinTrace gives users a chance to inspect the actual generated form. That is valuable because branches can affect performance, especially in tight loops or branch-heavy code. Modern CPUs predict branches, and bad predictions can cost cycles. You do not need to become a microarchitecture wizard overnight, but seeing branches in assembly builds the foundation.
A Practical Example: Function Calls
Function calls are another great learning target. A simple call may involve moving arguments into registers, preserving values, adjusting the stack, jumping to another address, and returning. The exact details depend on the architecture, ABI, compiler, optimization level, and whether the function is inlined.
When a compiler inlines a function, the call may disappear entirely. Instead of jumping to a separate function body, the compiler inserts the function’s logic directly into the caller. This can improve performance by avoiding call overhead and enabling further optimization. But it also makes source-to-assembly mapping more complex. PenguinTrace helps learners see the difference between a real call and code that has been inlined.
Why PenguinTrace Is Especially Useful For Students
Assembly language education often has a rough landing. Students go from friendly C code to instruction mnemonics, registers, addressing modes, stacks, flags, and memory layouts. That transition can feel like switching from driving a car to manufacturing pistons while the engine is running.
PenguinTrace softens the transition. It lets students write small programs, run them, and watch the lower-level behavior. Instead of reading twenty pages about registers before seeing any effect, they can step through an addition, a loop, a branch, or a function call. Visual feedback shortens the distance between theory and understanding.
It also encourages experimentation. What happens if a variable becomes volatile? What happens if a function is marked static? What happens if the loop count is known at compile time? What changes when a value is a pointer instead of an integer? These small experiments teach compiler behavior better than memorized rules.
Why Professionals Should Care Too
PenguinTrace is educational, but the skill it teaches is professional. Senior developers often inspect assembly when diagnosing performance regressions, verifying compiler output, investigating undefined behavior, checking calling conventions, or learning how a particular architecture handles code generation.
Even when professionals use heavier tools, the mental model is the same. They need to connect source code to machine instructions. They need to understand why a variable is unavailable in a debugger, why a hot loop uses unexpected memory loads, or why an apparently simple expression generates more instructions than expected. PenguinTrace helps build that intuition in a low-friction environment.
Best Practices For Learning With PenguinTrace
Start with tiny programs. Do not begin with a 3,000-line application unless your hobby is emotional damage. Use functions with one or two statements. Add complexity slowly. Compare arithmetic, branching, loops, arrays, pointers, structs, and function calls.
Next, change one thing at a time. If you change the data type, optimization level, function structure, and architecture all at once, you will not know which change caused the assembly difference. Good experiments isolate variables. Bad experiments produce confusion and a suspicious number of browser tabs.
Finally, write notes. When you discover that a loop becomes a constant, or that arguments are passed in registers, write it down. Assembly learning improves when observations become patterns.
Common Mistakes When Reading Assembly
Assuming Every Instruction Is Expensive
Not all instructions have the same cost. Some are cheap, some are expensive, and modern CPUs execute instructions in complex ways. Avoid judging performance only by instruction count. It is a useful clue, not a final verdict.
Ignoring Optimization Settings
Assembly output changes dramatically depending on compiler flags. A debug build and a release build can look like distant cousins who only meet at weddings. Always know how the code was compiled.
Forgetting About Undefined Behavior
In C and C++, undefined behavior gives the compiler room to make assumptions that may surprise you. If assembly output looks impossible, check whether the source code has undefined behavior before blaming the compiler.
Reading Assembly Without Architecture Context
x86-64 and AArch64 use different instruction styles, registers, calling conventions, and memory models. PenguinTrace can help expose these differences, but you still need basic architecture awareness.
Where PenguinTrace Fits In A Modern Developer Toolbox
A strong workflow might look like this: use PenguinTrace to learn and visually explore execution; use Compiler Explorer to compare compiler versions and flags; use GDB for real debugging sessions; use objdump or llvm-objdump for binary inspection; use perf or profiling tools for performance evidence; and use architecture manuals when you need authoritative instruction details.
No single tool owns the whole problem. PenguinTrace shines as an educational and exploratory tool. It gives learners and developers a more approachable way to see the relationship between source code, assembly, registers, and execution. Once you understand that relationship, other tools become easier to use.
Experience Notes: What You Learn After Spending Time With Source-To-Assembly Mapping
The first experience most people have with source-to-assembly mapping is mild panic. You write something innocent like return x + 1;, press compile, and suddenly you are looking at registers, stack frames, labels, and instructions that appear to have been named by someone who disliked vowels. PenguinTrace helps because it turns that panic into curiosity. The side-by-side mapping says, in effect, “This instruction came from that idea.” That connection is the hook.
After a few sessions, patterns begin to appear. You notice that simple integer parameters often arrive in registers. You notice that return values use predictable locations. You notice that loops usually involve comparison and branch instructions unless the compiler optimizes them away. You notice that array indexing is really address calculation wearing a nice sweater. These discoveries make programming feel less abstract and more physical. Code becomes motion: values move, instructions test, branches jump, functions call, and memory waits patiently in the background like a warehouse clerk with infinite shelves.
One useful exercise is to write several versions of the same idea. Create one function that adds two numbers. Then add a branch. Then add a loop. Then use an array. Then pass a pointer. Each time, inspect the assembly mapping. The goal is not to become fluent in every mnemonic immediately. The goal is to build recognition. When you see a compare followed by a conditional jump, you know a decision is happening. When you see loads and stores around an address, you know memory is involved. When you see a call instruction, you know control is moving to another function unless optimization has changed the plan.
Another valuable experience is comparing debug-style output with optimized output. In unoptimized code, the compiler often preserves a structure that resembles the original source. This makes it easier to learn but can also give a misleading sense of how production code behaves. Optimized code is more revealing. It shows that the compiler is not a literal translator; it is an aggressive problem solver. It may remove work, combine operations, inline functions, or keep values entirely in registers. At first this feels like betrayal. Later it feels like respect. The compiler is doing the boring cleverness so your program can run faster.
PenguinTrace also teaches humility. Many developers believe they know what their code “obviously” does at the machine level. Then they inspect the assembly and discover extra conversions, missed optimizations, memory traffic, or surprising control flow. This is not failure. It is education. The machine has no interest in your assumptions. It only executes instructions. Source-to-assembly mapping is how you audit the distance between what you meant and what the CPU received.
For teaching, PenguinTrace is especially effective because it rewards small experiments. Instead of lecturing for an hour about calling conventions, an instructor can show a tiny function and let students watch arguments appear in registers. Instead of explaining loops as an abstract control-flow structure, the class can step through the branch instruction that returns execution to the top. The result is memorable because students see cause and effect.
For self-study, the best habit is to keep examples small and repeatable. Save snippets. Label observations. Compare architectures if possible. Do not worry when the assembly looks intimidating. Assembly is not a monster; it is just extremely literal. PenguinTrace gives you a safe place to meet it without being bitten by a 600-page manual.
Conclusion
PenguinTrace makes source code to assembly mapping more approachable by combining compilation, assembly viewing, and step-by-step execution tracing in a visual workflow. It is not meant to replace every debugger, disassembler, or performance tool. Instead, it gives developers a clearer way to understand what their code becomes after compilation and how that code behaves at the instruction level.
For beginners, PenguinTrace turns assembly from a scary wall of symbols into a guided learning experience. For experienced programmers, it reinforces the mental model needed for debugging, optimization, compiler analysis, and systems-level reasoning. The more you understand the mapping between source and assembly, the less mysterious your programs become. And in software, fewer mysteries usually means fewer late nights, fewer bugs, and fewer conversations with your keyboard that begin with “Why are you like this?”
Note: This publication-ready article is based on real public technical information about PenguinTrace, Linux development tools, compiler output, disassembly, DWARF debug information, and source-level debugging workflows.
SEO Tags