
A 50/50 stock/bond portfolio sounds like the financial equivalent of ordering half salad, half fries. You want growth, but you also want to sleep at night. You want stocks to do the heavy lifting, but you want bonds standing nearby with a helmet, a clipboard, and a calming voice.
So the big question is simple: what is the worst 10 year return from a 50/50 stock/bond portfolio? Historically, for a simple U.S. portfolio split evenly between stocks and high-quality bonds and rebalanced annually, the worst rolling 10-year return has been surprisingly mild in nominal terms: just over 2% per year. That does not mean every investor felt cozy during those years. The Great Depression, the inflationary 1970s, the dot-com crash, the global financial crisis, and the 2022 bond shock all handed investors plenty of emotional bruises. But over full 10-year windows, the balanced approach has been far more durable than many people expect.
This article breaks down what that number means, why it happened, what it does not guarantee, and how investors can think about a 50/50 portfolio in the real worldwhere taxes, fees, inflation, withdrawals, and panic-selling exist, usually wearing steel-toed boots.
What Is a 50/50 Stock/Bond Portfolio?
A 50/50 stock/bond portfolio is an investment portfolio that allocates 50% of its value to stocks and 50% to bonds. The stock side is typically designed for long-term growth, while the bond side is meant to provide income, stability, and a cushion during stock market declines.
In historical U.S. studies, the stock portion is often represented by the S&P 500 or a broad U.S. stock market index. The bond portion is often represented by U.S. Treasury bonds, intermediate-term government bonds, or a broad bond index such as the Bloomberg U.S. Aggregate Bond Index. The exact benchmark matters because long-term Treasury bonds, short-term bonds, corporate bonds, and total bond market funds can behave differently.
The most important assumption is rebalancing. A portfolio that starts at 50/50 will not stay there on its own. If stocks surge, the portfolio may drift to 60/40 or 70/30. If stocks crash, it may become bond-heavy. Rebalancing brings it back to the target allocation by trimming the winner and buying the laggard. This sounds easy in a spreadsheet and deeply annoying in real life, especially when the laggard looks like it fell down the stairs.
The Historical Answer: The Worst 10-Year Return Was Just Over 2% Annually
Based on widely cited historical rolling-return analysis going back to 1928, a basic 50/50 U.S. stock/bond portfolio that was rebalanced annually never produced a negative nominal return over any rolling 10-year calendar period. Its worst 10-year annualized result was just over 2% per year.
That is the headline. But headlines are like potato chips: tasty, incomplete, and dangerous if consumed alone. A 2% annual return over 10 years is not exciting. It is not “retire early and buy a lake house” money. After inflation, it may feel flat or even disappointing. But compared with the possibility of large stock market losses, a positive nominal return through some of the most brutal economic periods in modern U.S. history is impressive.
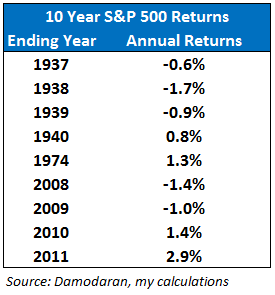
Think about what this includes. The data set covers the Great Depression, when stocks collapsed dramatically. It includes the 1970s, when inflation chewed through purchasing power like a raccoon in a pantry. It includes the early 2000s, when technology stocks went from “new economy miracle” to “please do not open my brokerage statement.” It includes the 2008 financial crisis, when investors suddenly learned which banks had been playing financial Jenga with the lights off.
Through those 10-year windows, the balanced portfolio did not always thrive. But historically, it survived.
Why Did the 50/50 Portfolio Hold Up So Well?
Stocks and Bonds Often Struggle at Different Times
The basic idea behind diversification is that different assets do not always move together. Stocks represent ownership in businesses. Bonds represent loans to governments or companies. When investors are optimistic, stocks may rise faster. When fear spreads, high-quality bonds may benefit as investors seek safety.
This relationship is not perfect. Sometimes stocks and bonds fall together, as they did in 2022 when inflation and rising interest rates punished both sides. But over long historical periods, bonds have often provided ballast when stocks were under pressure.
Rebalancing Forces Discipline
A 50/50 portfolio works best when it is actually managed as a 50/50 portfolio. Annual rebalancing may require selling some of what has done well and buying what has done poorly. Emotionally, this can feel backward. Practically, it is one of the reasons balanced portfolios have historically performed better than investors might expect.
For example, after a major stock decline, rebalancing may push the investor to buy stocks at lower prices. After a long bull market, it may force the investor to take some profits and rebuild the bond cushion. It is not magic. It is a rules-based way to avoid letting fear and greed grab the steering wheel.
Bonds Provided Income When Yields Were Higher
In many historical periods, bonds paid meaningful interest. That income helped offset stock declines and contributed to long-term returns. In the early 1980s, for example, bond yields were extremely high. Investors who held bonds after yields peaked benefited from both income and price appreciation as interest rates later declined.
However, this also means investors should be careful about assuming the past will repeat exactly. Bond returns depend heavily on starting yields, inflation, and changes in interest rates.
Nominal Return vs. Real Return: The Inflation Problem
The phrase “never negative over 10 years” sounds wonderful until inflation walks into the room and starts unplugging the appliances. A nominal return is the return before adjusting for inflation. A real return is what remains after accounting for the rising cost of living.
If a portfolio earns 2% per year while inflation runs at 4% per year, the investor has a positive nominal return but a negative real return. The account balance may be higher, but purchasing power may be lower. That is why the worst 10-year return from a 50/50 stock/bond portfolio should not be interpreted as “you cannot lose.” You absolutely can lose purchasing power.
This matters most for retirees or anyone drawing from a portfolio. A worker still saving money can often ride out a low-return decade. A retiree taking withdrawals during that same period faces a harder challenge because selling assets during weak markets can permanently reduce the portfolio’s ability to recover.
The 1970s: When Inflation Made Everything Weird
The 1970s are a useful reminder that a balanced portfolio can look better on paper than it feels in real life. Stocks struggled, inflation surged, and interest rates rose. Bonds, which many investors view as the “safe” side of a portfolio, also faced pressure because rising rates push bond prices down.
A 50/50 portfolio helped reduce volatility compared with an all-stock portfolio, but inflation reduced the value of the returns investors actually kept. This is why long-term investors should think beyond the simple stock/bond split and consider the role of cash reserves, Treasury Inflation-Protected Securities, international diversification, and spending flexibility.
In other words, a 50/50 portfolio is a strong base, not a superhero cape.
The Great Depression: The Ultimate Stress Test
The Great Depression was one of the most severe stock market disasters in U.S. history. Stocks lost an enormous amount of value from peak to trough, and the economy suffered deeply. If any period should have destroyed confidence in a balanced portfolio, it was this one.
Yet the presence of bonds helped. High-quality bonds held up much better than equities, giving the 50/50 portfolio a stabilizing force. Investors who rebalanced annually would have been pushed to buy stocks after large declines, which later helped when stocks recovered.
That said, the real-world experience would have been psychologically brutal. It is one thing to say “rebalance into stocks” while sitting comfortably in 2026 with a latte and a chart. It is another thing to do it during bank failures, unemployment, and terrifying headlines. Historical data shows what was possible. It does not show how many investors had the stomach to follow the plan.
What About the 2000s and the Global Financial Crisis?
The 2000s were another tough stretch for stock investors. The decade began with the dot-com bubble bursting and ended with the global financial crisis. The S&P 500 delivered poor results over the full decade, and many investors felt like they had spent 10 years running on a treadmill that occasionally caught fire.
A 50/50 stock/bond portfolio performed much better than an all-stock approach because bonds delivered positive returns during parts of the decade when stocks suffered. This is one of the clearest examples of why balanced investing can be valuable. The goal is not to win every bull market. The goal is to avoid being financially and emotionally destroyed during bear markets.
Why 2022 Shook Confidence in the 50/50 Portfolio
For many investors, 2022 was the year bonds forgot to bring the parachute. Stocks fell as inflation surged and the Federal Reserve raised interest rates aggressively. Bonds also fell because rising yields reduced the prices of existing bonds. The result was one of the most uncomfortable years for traditional balanced portfolios in modern history.
This was a reminder that bonds are not risk-free. They have interest-rate risk, inflation risk, and sometimes credit risk. Long-duration bonds can be especially sensitive to rising rates. Investors who thought bonds could only move politely in small increments learned otherwise.
Still, one terrible year does not erase the long-term case for diversification. The lesson is more specific: investors should understand what kind of bonds they own, how much duration risk they are taking, and whether their bond allocation matches their time horizon.
How a 50/50 Portfolio Compares With 60/40 and 100% Stocks
The classic 60/40 portfolio is more growth-oriented than a 50/50 portfolio because it holds more stocks. Over long periods, that extra stock exposure may increase returns. It also increases volatility and potential drawdowns.
A 100% stock portfolio has historically offered higher long-term returns, but the ride can be stomach-churning. There have been rolling 10-year periods when stocks alone produced negative returns. A 50/50 portfolio historically reduced that risk because bonds helped stabilize the total result.
The trade-off is simple: more stocks can mean higher long-term growth, but also deeper declines. More bonds can mean smoother returns, but potentially lower long-term growth. There is no perfect allocation. There is only the allocation an investor can stick with when the market starts throwing furniture.
Who Might Use a 50/50 Stock/Bond Portfolio?
A 50/50 portfolio may appeal to investors who want moderate growth with reduced volatility. It is often considered by people near retirement, early retirees, conservative long-term investors, or anyone who knows they would panic-sell an all-stock portfolio at the worst possible moment.
It may be too conservative for a young investor with a very long time horizon and strong risk tolerance. It may be too aggressive for someone who needs the money soon or cannot handle meaningful account declines. The right allocation depends on time horizon, income needs, risk tolerance, savings rate, tax situation, and personal behavior.
Behavior deserves extra attention. A theoretically optimal portfolio is useless if the investor abandons it during the first major downturn. A slightly more conservative portfolio that keeps someone invested may beat an aggressive portfolio that gets panic-sold at the bottom.
Key Lessons From the Worst 10-Year Return
Lesson 1: Diversification Is Boring Until It Saves You
Diversification rarely feels brilliant during bull markets. When stocks are soaring, bonds can look like the dull relative at the family picnic explaining municipal finance. But during stock market crashes, that dull relative may be the only person who remembered to bring a first-aid kit.
Lesson 2: Positive Nominal Returns Are Not the Same as Wealth Growth
A 2% annual return over 10 years may preserve nominal capital, but it may not preserve purchasing power after inflation. Investors should evaluate both nominal and real returns when planning for retirement or long-term goals.
Lesson 3: Rebalancing Is Easy to Understand and Hard to Do
Rebalancing sounds simple: sell what went up, buy what went down. In practice, it often requires buying assets that everyone currently hates. This is why having a written investment policy can help. The decision is made before emotions start yelling.
Lesson 4: The Future May Be Different
Historical results are useful, but they are not promises. Future returns will depend on valuations, yields, inflation, economic growth, policy decisions, and investor behavior. A 50/50 portfolio has a strong historical record, but no portfolio is immune to disappointment.
Practical Example: A $100,000 50/50 Portfolio During a Bad Decade
Suppose an investor starts with $100,000 in a 50/50 stock/bond portfolio. If the portfolio earns 2% annually for 10 years, it grows to about $121,900 before taxes and fees. That is not thrilling, but it is still positive.
Now compare that with a severe all-stock decade where stocks lose money or barely break even. The balanced investor may feel frustrated, but the all-stock investor may feel trapped. The balanced portfolio’s value is not just in maximizing returns. It is in reducing the odds that a bad decade completely derails the plan.
However, if inflation averaged 3% or 4% during that same decade, the investor’s purchasing power would decline. This is why a 50/50 strategy should be paired with realistic expectations, low costs, tax awareness, and a plan for inflation.
How to Make a 50/50 Portfolio More Resilient
Investors who like the 50/50 concept can improve the structure by paying attention to what sits inside each half. On the stock side, a broad U.S. total market fund or S&P 500 fund can provide diversified equity exposure. Some investors may add international stocks to reduce dependence on one country’s market.
On the bond side, investors can consider a mix of short-term bonds, intermediate-term bonds, Treasury bonds, investment-grade bonds, and Treasury Inflation-Protected Securities. The right mix depends on whether the investor wants income, stability, inflation protection, or liquidity.
Costs also matter. A portfolio earning 2% in a weak decade cannot afford a 1% advisory fee, expensive funds, unnecessary trading, and tax drag without feeling the pain. Low-cost funds are not exciting, but neither is overpaying for underperformance.
Experience-Based Reflections: What Investors Learn From Living With a 50/50 Portfolio
The first real experience many investors have with a 50/50 portfolio is emotional, not mathematical. On paper, the allocation looks balanced and sensible. In real life, half the portfolio always seems to be disappointing you. When stocks are rising, bonds feel like dead weight. When stocks are falling, the stock side feels like a raccoon loose in the kitchen. The investor’s job is not to love every part of the portfolio every year. The job is to understand why each part is there.
One common experience is regret during bull markets. Imagine watching friends brag about their all-stock portfolios during a roaring market. Your 50/50 portfolio is rising too, but more slowly. It can feel like showing up to a drag race in a reliable sedan with excellent safety ratings. You are moving forward, but nobody is asking to take selfies with your asset allocation. This is when investors are tempted to abandon balance and chase performance. Unfortunately, that temptation often appears late in the cycle, after stocks have already delivered huge gains.
Another experience comes during bear markets. Suddenly, the boring bond allocation looks less boring. It may not eliminate losses, especially if bonds are also struggling, but it can reduce the size of the decline. More importantly, it may reduce the emotional pressure to sell everything. A smaller loss is not just a financial advantage; it is a behavioral advantage. Investors who can stay calm enough to keep contributing, rebalance, or simply do nothing often end up better positioned for recovery.
Retirees experience the 50/50 portfolio differently from accumulators. A younger investor adding money every month may welcome lower stock prices because new contributions buy more shares. A retiree withdrawing money may see the same decline as a threat to lifestyle. This is why cash reserves and withdrawal flexibility matter. A 50/50 portfolio can be a strong retirement foundation, but it should not be the entire retirement plan. Spending rules, Social Security timing, pension income, tax planning, and emergency savings all affect the outcome.
Many investors also learn that “safe” is a slippery word. Bonds are safer than stocks in some ways, but they are not immune to losses. Bond funds can decline when interest rates rise. Longer-duration bonds can fall sharply. Corporate bonds can suffer during credit stress. The bond allocation should match the job it is supposed to do. If the goal is stability, an investor may not want the bond side loaded with long-duration or lower-quality debt just to chase a little extra yield.
The most valuable experience is realizing that a portfolio is not only a return machine. It is a behavior machine. A good portfolio helps the investor make fewer catastrophic decisions. The worst 10-year return from a 50/50 stock/bond portfolio is historically reassuring, but the bigger lesson is discipline. The investor who can stick with a reasonable plan through ugly markets often beats the investor who keeps searching for the perfect plan and changing it at the worst possible time.
Note: This article is for educational purposes only and should not be treated as personal financial advice. Historical returns are useful for perspective, but future market returns may be higher, lower, smoother, or much messier than the past.
Conclusion: The Worst Decade Was Not Great, But It Was Survivable
The worst 10-year return from a 50/50 stock/bond portfolio was historically just over 2% per year in nominal terms, assuming a simple U.S. stock and bond mix with annual rebalancing. That is not glamorous. It will not make anyone shout “compound interest!” from a balcony. But it is powerful evidence that diversification, patience, and discipline can help investors survive difficult markets.
The key word is survive. A 50/50 portfolio is not designed to beat stocks during roaring bull markets. It is designed to participate in growth while reducing the damage from severe downturns. For many investors, that trade-off is worth considering.
Still, investors should be realistic. Inflation can turn positive nominal returns into weak real returns. Taxes and fees can reduce results. Withdrawals can create sequence-of-returns risk. And future markets may not behave exactly like the past. The 50/50 portfolio is a tool, not a guarantee.
Used thoughtfully, though, it remains one of the simplest and most durable investment frameworks ever created. Sometimes boring is beautiful. Sometimes boring keeps you from selling at the bottom. And sometimes boring is exactly what a long-term portfolio needs.